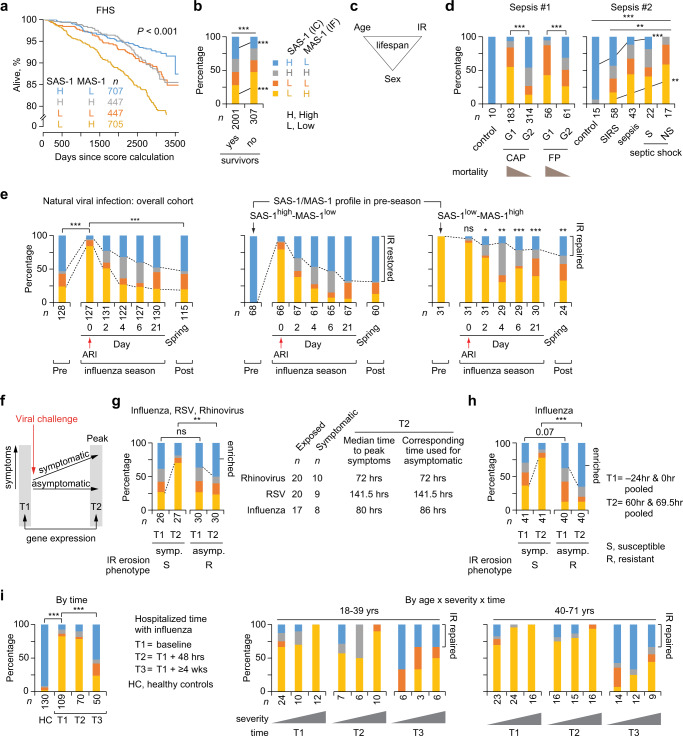
Fig. 8. Survival-associated signature (SAS)-1 and mortality-associated signature (MAS)-1 associate with mortality and acute respiratory viral infection outcomes.
a Proportion survived in the Framingham Heart Study (FHS) by SAS-1/MAS-1 groupings/profiles calculated at time 0. b Distribution of SAS-1/MAS-1 profiles in the FHS by survival status. c Model: age, sex, and immunologic resilience (IR) levels influence lifespan. d–g Representation of SAS-1/MAS-1 profiles. d Sepsis #1 comprises healthy controls and meta-analysis of patients with community-acquired pneumonia (CAP) and fecal peritonitis (FP) stratified by sepsis response signature groups (G1 and G2 associated with higher and lower mortality, respectively). Sepsis #2 comprises healthy controls and patients with systemic inflammatory response syndrome (SIRS), sepsis, and septic shock survivors (S) and nonsurvivors (NS). e Participants in a natural influenza season cohort (age: 18–49 years) sampled at pre and during acute respiratory infection (ARI) and at spring follow-up: overall (left) or according to the indicated SAS-1/MAS-1 profile during the pre-ARI season (right). P values (asterisks, ns) for participants with SAS-1low-MAS-1high at pre-ARI (right) are for their cross-sectional comparison to the profiles at the corresponding timepoints for participants with SAS-1high-MAS-1low at pre-ARI (middle). f Schema of the timing of gene expression profiling in experimental intranasal challenges with respiratory viral infection in otherwise healthy young adults with data presented in panels g and h. T, time. g Participants inoculated intra-nasally with respiratory syncytial virus (RSV), rhinovirus, or influenza virus stratified by symptom status and sampling timepoint. Symp. symptomatic, Asymp. asymptomatic. h Participants inoculated intra-nasally with influenza virus stratified by symptom status and sampling timepoint. i Individuals with severe influenza infection requiring hospitalization collected at three timepoints, overall, and by age strata and severity. Patients were grouped by increasing severity levels: no supplemental oxygen required, oxygen by mask, and mechanical ventilation. Cohort characteristics and sources of biological samples and gene expression profile data are in Supplementary Data 13a. *P < 0.05; **P < 0.01; ***P < 0.001; ns nonsignificant. Two-sided tests were used. Statistics are outlined in Supplementary Information Section 11.3.8., P values are in Supplementary Data 14, and Source data are provided as a Source Data file.

