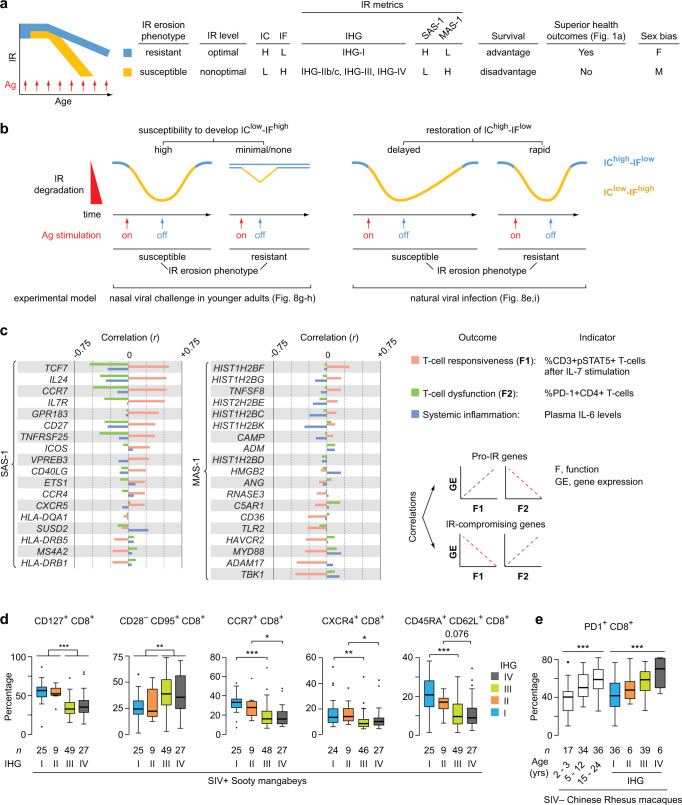
Fig. 9. Associations of Immunologic Resilience (IR) erosion phenotypes and immune correlates of IR.
a Schema of features associated with IR erosion phenotypes defined by immune health grade (IHG) status, and survival-associated signature (SAS)-1/mortality-associated signature (MAS)-1 profiles. Ag antigenic, F female, H high, IC immunocompetence, IF inflammation, L low, M male b IR erosion-resistant and IR erosion-susceptible phenotypes based on experimental models. c Correlation (r; Pearson) between expression levels of genes within SAS-1 and MAS-1 signatures with levels of an indicator for T-cell responsiveness, T-cell dysfunction, and systemic inflammation. Measures of T-cell responsiveness, T-cell dysfunction, and plasma IL-6 are from 55, 56, and 50 HIV+ individuals, respectively, on virally suppressive antiretroviral therapy from the early HIV infection cohort. d, e Levels of the indicated immune traits by IHGs in (d) sooty mangabeys seropositive for simian immunodeficiency virus (SIV) and (e) SIV-seronegative Chinese rhesus macaques. Comparisons were made between IHG-I vs. IHG-III and IHG-II vs. IHG-IV to mitigate the confounding effects of higher and lower CD4+ counts, respectively. *P < 0.05; **P < 0.01; ***P < 0.001. For box plots: center line, median; box, interquartile range (IQR); whiskers, rest of the data distribution and outliers greater than ±1.5 × IQR are represented as points. Two-sided tests were used. Statistics are outlined in Supplementary Information Section 11.3.9., P values are in Supplementary Data 14, and Source data are provided as a Source Data file.

