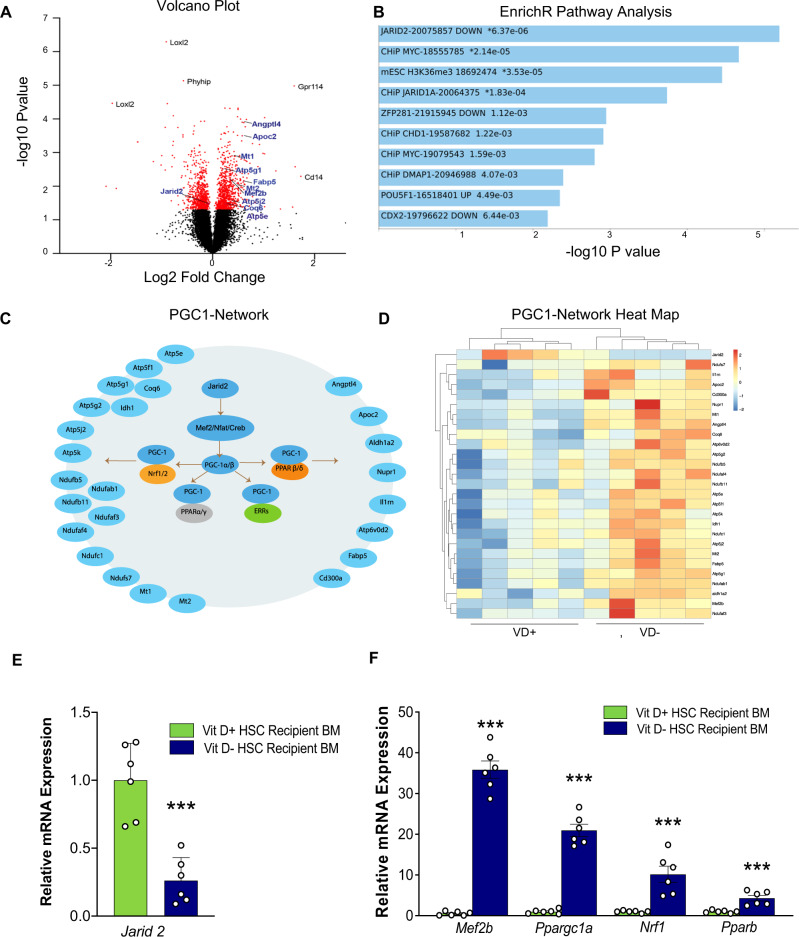
Fig. 2. Top genes, networks, and pathways identified in transcriptome analysis of bone marrow from recipient mice transplanted with HSCs isolated from embryos from VD-sufficient and -deficient dams.
VD(−) vs. VD( + ) FL-HSCs were transplanted into VD(+) mice, and global mRNA expression was evaluated by microarray in recipient BM cells at 16 weeks post-transplant. A Volcano plot showing top differentially expressed genes. Red dots indicate those array probes with P < 0.05. Black represents the non-significant probes. Genes of the Jarid2-PGC1-MEF2 pathway are highlighted in blue. P values for each probe were calculated using a two-tailed t test between five replicates in each condition. B Genes with significant changes were used for manual and automated pathway analysis. The figure shows EnrichR (PMID 23586463; 27141961; 33780170) top pathway hits from the ESCAPE database. Asterisks indicate those pathways that pass multiple testing corrections. EnrichR used Fisher’s exact test for P value calculation and Benjamini–Hochberg test for multiple testing corrections (C) Illustration of the Jarid2-MEF2-PGC1 network and the target genes that are differentially expressed in the array data. D Heatmap table showing normalized gene expression for Jarid2, MEF2-PGC1 target genes. Red indicates upregulation, and blue indicates downregulation. E, F Quantitative RT-PCR in FL-HSC transplant recipient BM to confirm expression changes in Jarid2 and PGC1α network-related genes (n = 6/group). Data presented as mean ± SEM. ***P < 0.001 vs. VD( + ) FL-HSCs recipients by two-tailed unpaired t test. Actual P values are shown in the source data file.

