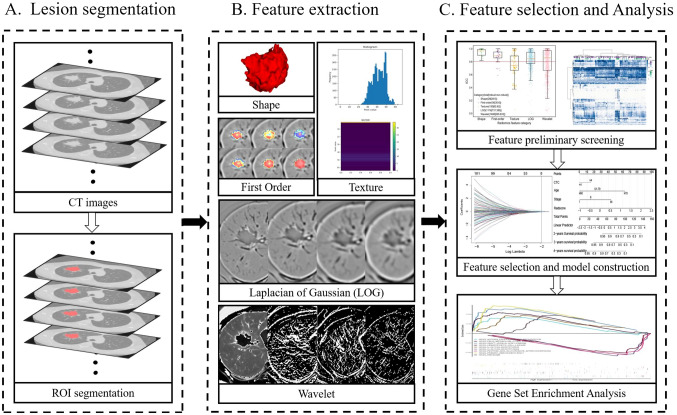
Fig. 1.
Flow chart of radiomics. A. Acquisition image data and segment the region of interest for the entire tumor; B. extract multiple quantitative features from the CT image, quantify the shape, first order, texture, Laplacian of Gaussian (LOG) texture and wavelet texture of the tumor-related information. D. After multiple screening, radiomics characteristics were comprehensively analyzed with clinical data and gene expression data

