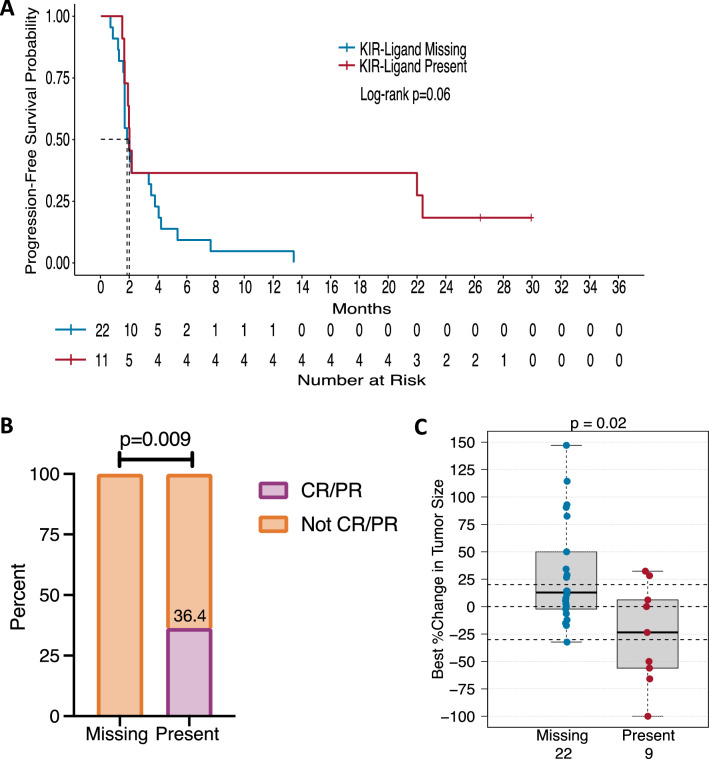
Fig. 2.
TNBC patients with a KIR/KIR-ligand present genotype have improved clinical response to BEMPEG plus nivolumab therapy. Kaplan–Meier curve for PFS (a) compares patients with a KIR-ligand missing genotype (blue line) to patients with a KIR-ligand present genotype (red line). OR is represented in (b) by the proportion of patients with a CR/PR (purple) compared to patients without a CR/PR (orange) based upon their KIR/KIR-ligand present/missing status. The box plots in (c) compare tumor shrinkage as indicated by the percent change in target lesion size from baseline for patients with a KIR-ligand missing genotype (blue) to patients with a KIR-ligand present genotype (red). Dotted horizontal lines indicate a +20% increase and −30% decrease in target lesion size from baseline

