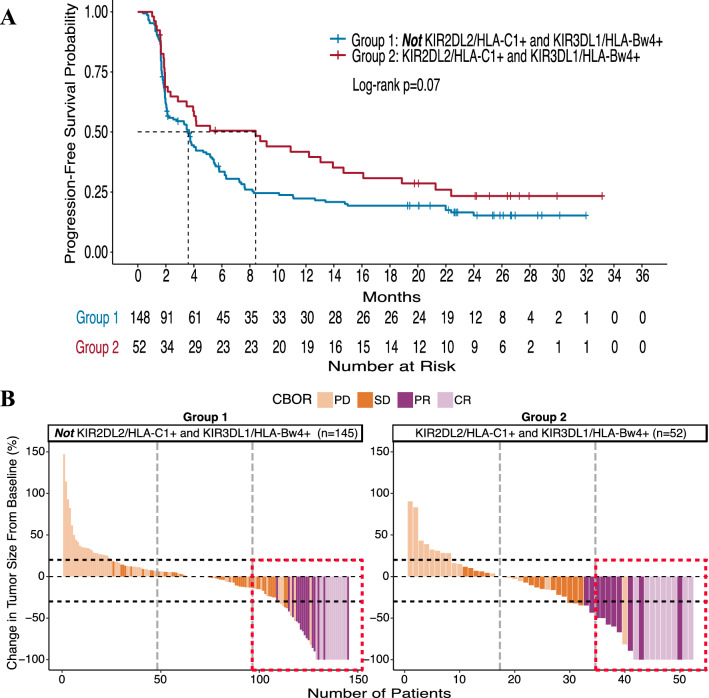
Fig. 4.
IO-naïve patients observe greater clinical benefit with a KIR2DL2+/HLA-C1+ and KIR3DL1+/HLA-Bw4+ genotype. Kaplan–Meier curve for PFS (a) compares patients who are KIR2DL2+/HLA-C1+ and KIR3DL1+/HLA-Bw4+ (Group 2, red line) to patients who are not KIR2DL2+/HLA-C1+ and KIR3DL1+/HLA-Bw4+ (Group 1, blue line). Waterfall plots displaying OR and tumor shrinkage (b) compares patients who are KIR2DL2+/HLA-C1+ and KIR3DL1+/HLA-Bw4+ (Group 2, right) with patients who are not KIR2DL2+/HLA-C1+ and KIR3DL1+/HLA-Bw4+ (Group 1, left). CBOR is the confirmed best overall response by RECIST 1.1 criteria; PD, progressive disease (light orange); SD, stable disease (orange); PR, partial response (purple); CR, complete response (light purple). Vertical dotted lines divide the number of patients into thirds, and horizontal dotted lines indicate a + 20% increase and −30% decrease in target lesion size from baseline. The dotted red box outlines the top third of patients, indicating a larger proportion of patients with a positive clinical response in Group 2 (right) than in Group 1 (left)

