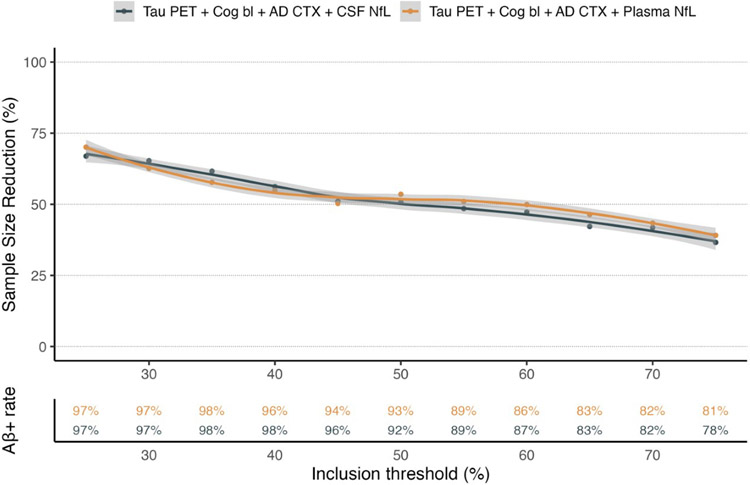
Figure 2. Enrichment for clinical trials using the parsimonious model biomarkers.
The top panel of the graph shows the effect on group size needed to include in a clinical trial to retain statistical power when enriching for pathological values for the tau-PET, Baseline cognition, cortical thickness and NfL biomarkers (cerebrospinal fluid (CSF) NfL in black, plasma NfL in orange). The bottom panel shows the rate of Aβ positivity with the different inclusion thresholds (CSF in black, plasma in orange).

