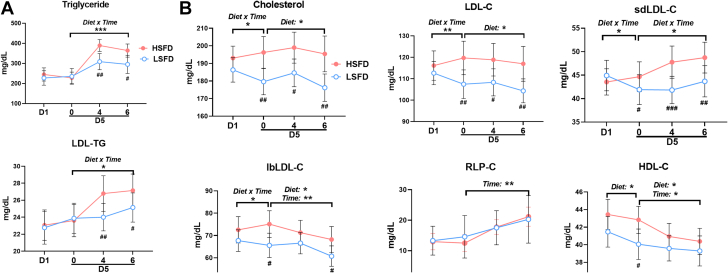
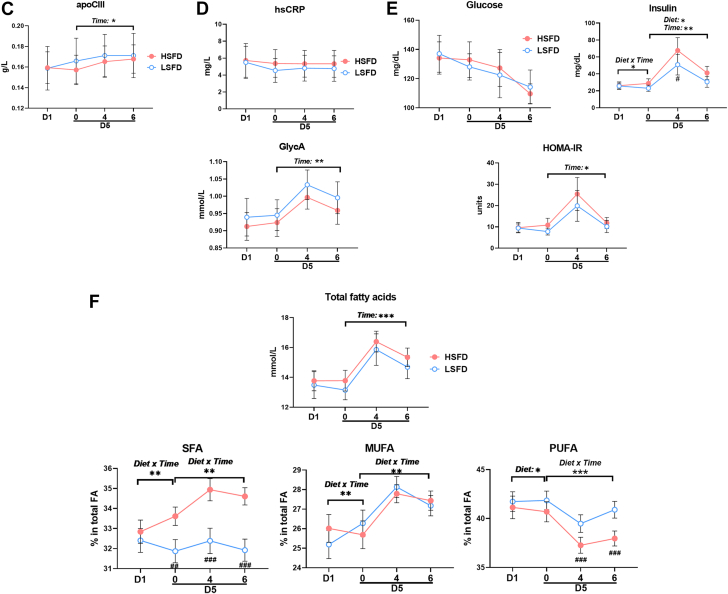
Figure 2.
Biochemical Profiles
(A) Plasma levels of triglyceride and low-density lipoprotein triglyceride (LDL-TG). (B) Plasma levels of total cholesterol; LDL cholesterol (LDL-C), including small dense LDL-C (sdLDL-C) and large buoyant LDL-C (lbLDL-C); remnant-like particle cholesterol (RLP-C); and high-density lipoprotein cholesterol (HDL-C). (C) Plasma levels of apolipoprotein CIII (apoCIII). (D) Plasma levels of high-sensitivity C-reactive protein (hsCRP) and glycoprotein acetylation (GlycA). (E) Plasma levels of glucose, insulin, and homeostatic model assessment for insulin resistance (HOMA-IR). (F) Plasma levels of total fatty acids and percentages of saturated fatty acids (SFA), monounsaturated fatty acids (MUFA), and polyunsaturated fatty acids (PUFA) in total fatty acids. Values are mean ± SEM. ∗P < 0.05, ∗∗P < 0.01, ∗∗∗P < 0.001 for main effects; #P < 0.05, ##P < 0.01, ###P < 0.001 post hoc test for pairwise comparisons between diets at indicated time points (day 1 [D1] fasting; day 5 [D5] fasting [0] and 4 hours [4] and 6 hours [6] after a test meal). HSFD = high–saturated fat diet; LSFD = low–saturated fat diet.


