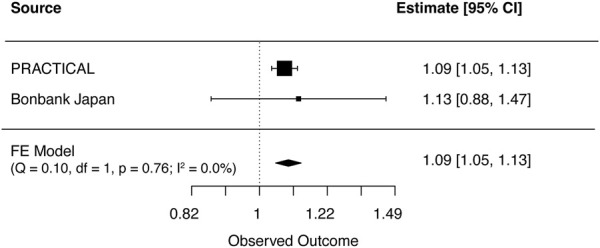
FIGURE 3.

Meta-analysis results for genetically predicted mLOY in relation to prostate cancer. The horizontal line indicates 95% CI by using the IVW approach, squares indicate estimates, square size is proportional to sample size, and rhombus indicates meta-analytically pooled estimates’ 95% CI. df, degrees of freedom, FE, Fixed effect; IVW, inverse variance weighted; MR, Mendelian randomization; CI, confidence interval.
