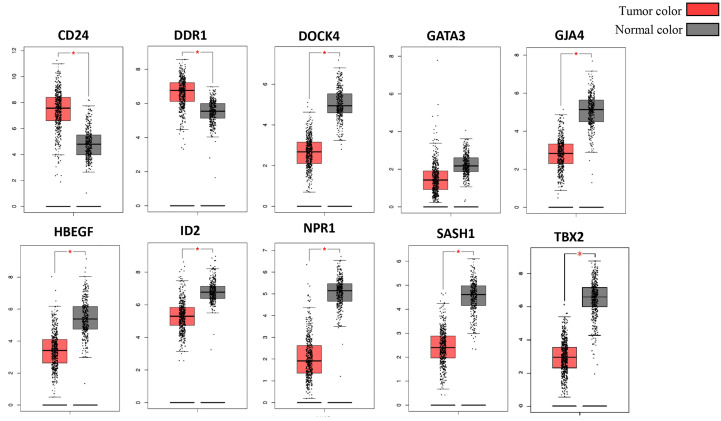
Figure 7.
Validation of identified DEGs in the Cancer Genome Atlas (TCGA) database. The box plot shows the expression of genes in mRNA using data from the TCGA database in GEPIA. The method for differential analysis is one-way ANOVA, using disease state. The data was consistent with our study, and their p-values <0.05. The * indicates the difference in gene expression between normal and diseased tissues.

