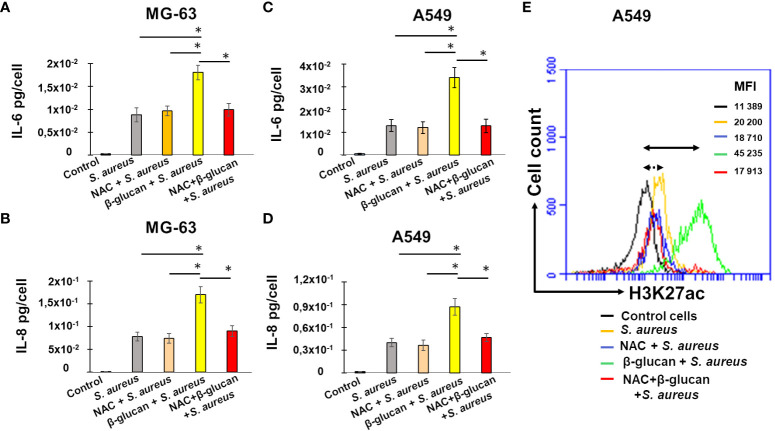
Figure 7.
NAC addition before β-glucan-pretreatment decreases IL-6 and IL-8 production upon a stimulation with S. aureus. Osteoblast-like MG-63 or lung epithelial A549 cells (20,000 cells/well) were seeded in wells of 24-well plates. Cells were exposed to the cultivation medium or to β-glucan, followed by the incubation for 5 days before an exposure to S. aureus at MOIs 60:1, as described in Material and Methods. When indicated cells were pretreated with 1 mM of NAC for 1 h prior to β-glucan and NAC exposure for 24 h or pretreated with NAC for 24 h, followed by the incubation for 5 days before an infection with S. aureus. The production of IL-6 and IL-8 was quantified in corresponding supernatants by ELISA and normalized by the number of cells in each well (A–D). Cell supernatants were collected (i) from control untreated cells at the end of experiment (black bar graph), (ii) from cells incubated with a cultivation medium for 24 h, followed by a 5 day-resting period before the exposure to S. aureus (grey bar graph), (iii) from cells pretreated with NAC for 1 h and incubated for additional 24 h in the NAC-containing cultivation medium, followed by a 5-day resting period before a S. aureus infection (rose bar graph), (iv) from cells pretreated with β-glucan for 24 h, followed by a 5 day-resting period before an exposure to S. aureus (yellow bar graph), (v) from NAC-treated cells for 1 h before an exposure to β-glucan and NAC for 24 h, followed by a 5 day-resting period before S. aureus infection (red bar graph). The differences among the groups corresponding to different treatments were assessed by analysis of variance (ANOVA) followed by a Tukey’s Honestly Significant Difference test. (*) P-values ≤ 0.05 were considered to be significant. The remaining cells after supernatants collection were used for flow cytometry analysis (E) as described in Material and Methods. Briefly, cells were treated with Trypsin/EDTA, and fixed in 4% paraformaldehyde/PBS followed by permeabilization in 0.1% Triton/0.5% BSA/PBS. Cells were subsequently incubated with anti-H3K27ac antibody diluted in PBS/2%BSA (1:50) for 1 h. Cells were then resuspended in PBS and were analyzed for H3K27 acetylation using an Accuri C6 flow cytometer (FL2 channel). Data were collected from 20,000 cells and analyzed using the CFlow software. Cells were analyzed using FSC-A x SSC-A plot. The major density of events was captured by the gate. The events corresponding to debris, cell fragments, and pyknotic cells were eliminated. Values shown on the right side of the graph refer to the respective mean fluorescence intensities (MFIs). The graph shows different lines for various treatments: a black line for untreated control cells, a yellow line for non-trained cells exposed to S. aureus (MOI 60:1) after a 5-day resting time, a green line for β-glucan-trained cells exposed to S. aureus after a 5-day resting time, a blue line for NAC-treated cells exposed to S. aureus after a 5-day resting time, and a red line for NAC-treated cells exposed to β-glucan followed by a 5-day resting time before S. aureus infection. Double arrow shows the shift between the fluorescence corresponding to the level of acetylation in control untreated cells (black line) and β-glucan pretreated cells exposed to S. aureus (green line). Dotted double arrow shows the shift between the fluorescence corresponding to the level of acetylation in control untreated cells (black line) and NAC and β-glucan pretreated cells exposed to S. aureus (red line). The results of the one representative flow cytometry analysis is shown.

