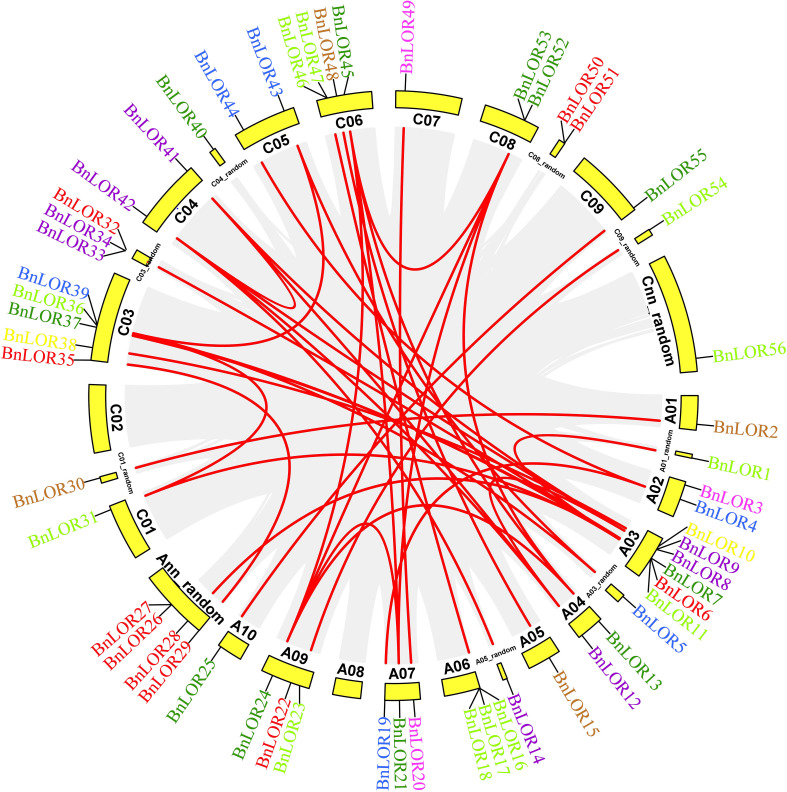
Figure 4.
Chromosome locations and inter-chromosomal associations of BnLOR genes. Grey lines in the background display all syntenic blocks in the B. napus genome and the red lines display syntenic BnLOR gene pairs. Different color of genes is accordance with their group distribution in Figure 1 .

