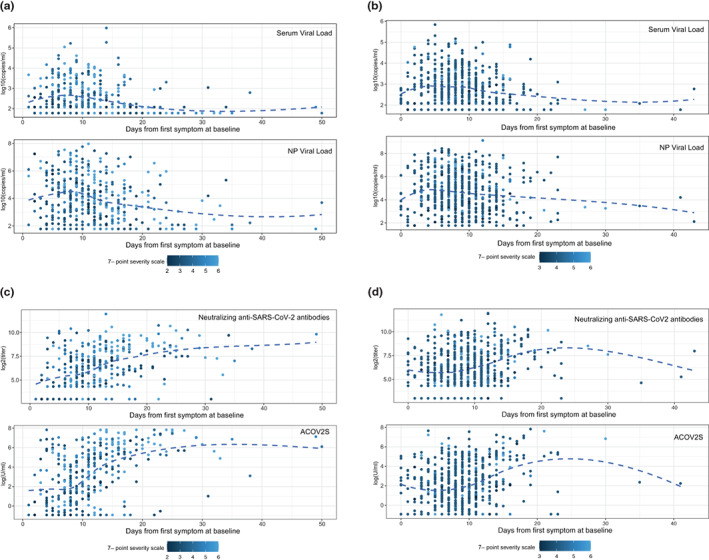
FIGURE 1.

Relationship of viral load and antibodies with time from symptom onset. Baseline SARS‐CoV‐2 viral load was measured by RT‐qPCR from serum samples and NP swabs in (a) COVACTA and (b) REMDACTA. Baseline neutralizing antibodies were measured by PRNT80 and ASCOV2S was measured by immunoassay in (c) COVACTA and (d) REMDACTA. Each dot represents a sample from one patient collected at baseline and is colored according to clinical status on the 7‐point ordinal score at baseline. The dashed line is the locally weighted scatterplot smoothing (LOWESS) curve. Ab, antibodies; ASCOV2S, anti‐SARS‐CoV‐Spike; NP, nasopharyngeal; PRNT, plaque reduction neutralization test; RT‐qPCR, reverse transcriptase‐quantitative polymerase chain reaction; SARS‐CoV‐2, severe acute respiratory syndrome coronavirus‐2.
