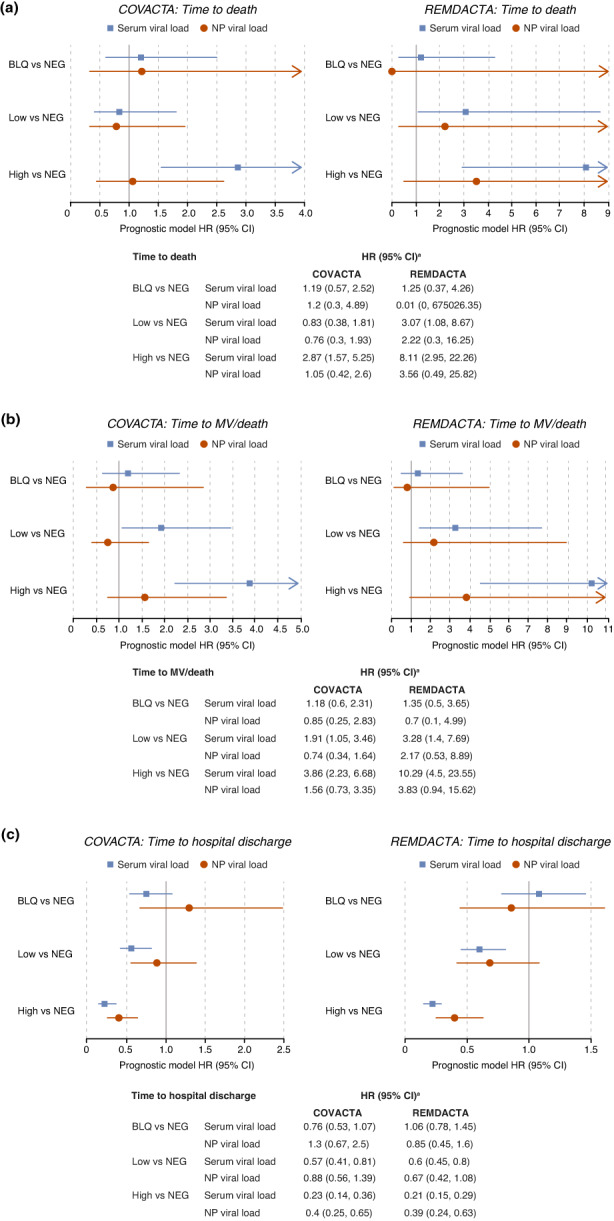
FIGURE 4.

Prognostic value of viral load subgroups for clinical outcomes. Estimates of hazard ratios in BLQ, low, and high versus NEG viral load groups for clinical outcomes of (a) time to death, (b) time to mechanical ventilation/death, and (c) time to hospital discharge. aAll models were controlled for treatment arm, age as a continuous variable, stratification factors (geographic region and mechanical ventilation in COVACTA; geographic region and baseline ordinal scale in REMDACTA), and, for COVACTA, baseline ordinal scale of clinical status. BLQ, below the limit of quantification; CI, confidence interval; HR, hazard ratio; MV, mechanical ventilation; NEG, negative; NP, nasopharyngeal.
