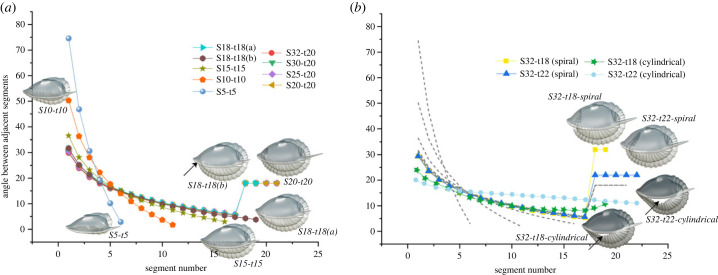
Figure 3.
(a,b) Kinematic curve showing the articulation angle between successive segments obtained with the expression . (a) Models based on individuals with two instars after the onset of the holaspid period. (b) Models based on five instars after the onset of the holaspid period. Grey dashed lines in (b) correspond with the trajectories of individuals with two instars (electronic supplementary material, table S1).

