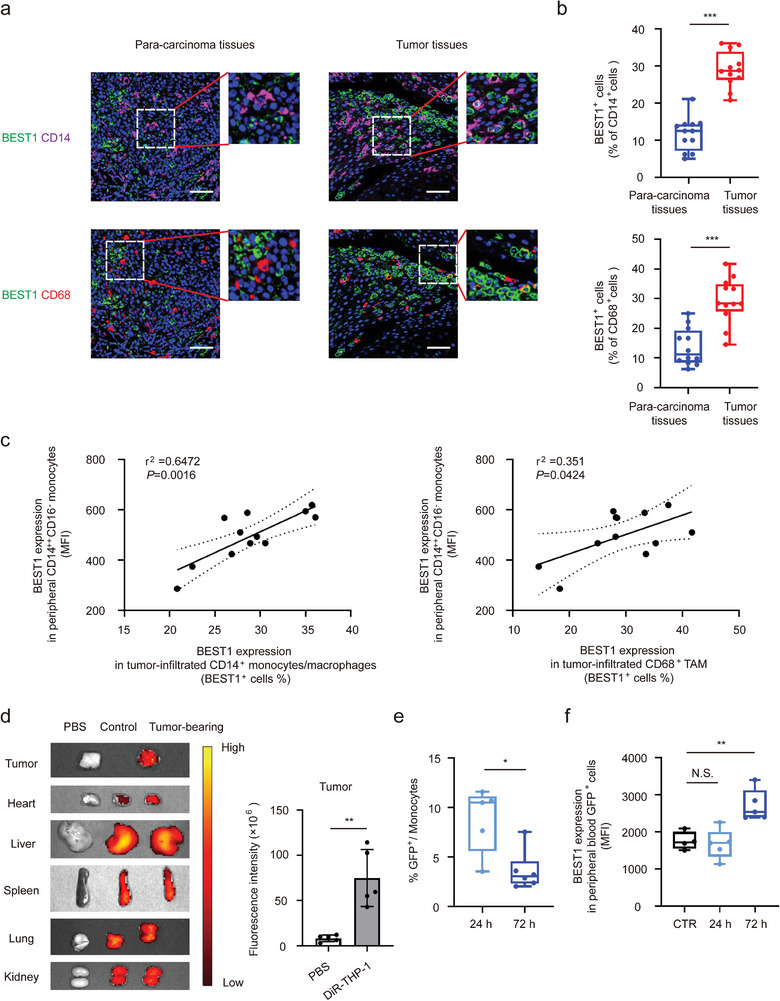
Figure 2.

The monocytes with high expression of BEST1 in peripheral blood are derived from the release of tumor‐infiltration monocytes. a,b) Representative images (a) and quantification (b) of BEST1+ monocytes and macrophages in HNSCC tumors and adjacent para‐cancer tissues (n = 12 from one experiment representative of three independent experiments). Blue, DAPI; magenta, CD14; red, CD68; green, BEST1. Scale bar, 100 mm. c) BEST1+ cell ratio in tumor‐infiltrated CD14+monocytes/macrophages and CD68+ TAMs are associated with BEST1 expression in peripheral CD14++ monocytes (n = 12) (Pearson's correlation coefficient R and two‐tailed p values are shown). d) Representative ex vivo fluorescent images of the DiR‐labeled THP‐1 in tumors and other organs (n = 5 mice per group from one experiment representative of two independent experiments). e,f) GFP‐THP‐1 was injected into tumor‐bearing mice, after 24 or 72 h, the ratio of GFP+ cells (e) and BEST1 expression level (f) in peripheral blood monocytes by flow cytometry (n = 5 mice per group from one experiment representative of two independent experiments). Data are represented as mean ± SD. Statistical significance is indicated by *p < 0.05, **p < 0.01, ***p < 0.001. N.S. = not significant; Student's t‐test (b,d,e); one‐way ANOVA (f).
