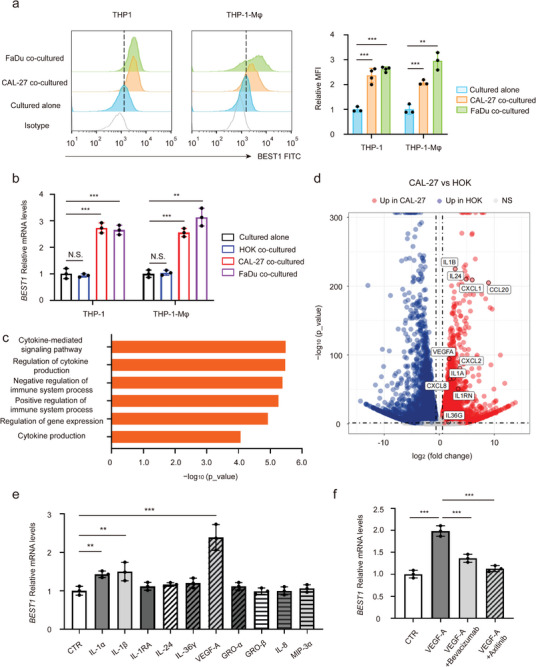
Figure 3.

Tumor cells induce BEST1 expression on monocytes and TAMs. a,b) THP‐1 cells/THP‐1‐derived macrophages (THP‐1‐Mφ) were cocultured with tongue squamous carcinoma cells CAL27, pharynx squamous carcinoma cells FaDu, or normal oral squamous epithelial HOK cells for 3 days. a) Representative histograms and summarized MFI for the expression of BEST1 by flow cytometry on THP‐1 and THP‐1‐Mφ (n = 3 per group from one experiment representative of three independent experiments). b) Relative BEST1 mRNA levels in THP‐1 and THP‐1‐Mφ. The data are normalized to GAPDH (n = 3 per group from one experiment representative of three independent experiments). c) MetaCore Gene Ontology processes analysis displaying the processes associated with cytokines of CAL27 cells. d) Volcano plot showing the up‐ and down‐regulated transcripts by RNA sequencing in CAL27 compared to HOK cells (n = 3 per group). e) Relative BEST1 mRNA levels in THP‐1 treated with 10 ng mL−1 cytokines for 24 h, respectively (n = 3 per group from one experiment representative of three independent experiments). f) After pretreatment with the humanized monoclonal antibody to VEGF‐A, Bevacizumab (0.2 µg mL−1), and the multi‐targeted tyrosine kinase inhibitor for VEGFR, Axitinib (5 nm) for 12 h, THP‐1 cells were stimulated with VEGF‐A for 24 h. Relative BEST1 mRNA levels in THP‐1 (n = 3 per group from one experiment representative of three independent experiments). Data are represented as mean ± SD. Statistical significance is indicated by **p < 0.01, ***p < 0.001. N.S. = not significant; one‐way ANOVA (a,b,e,f).
