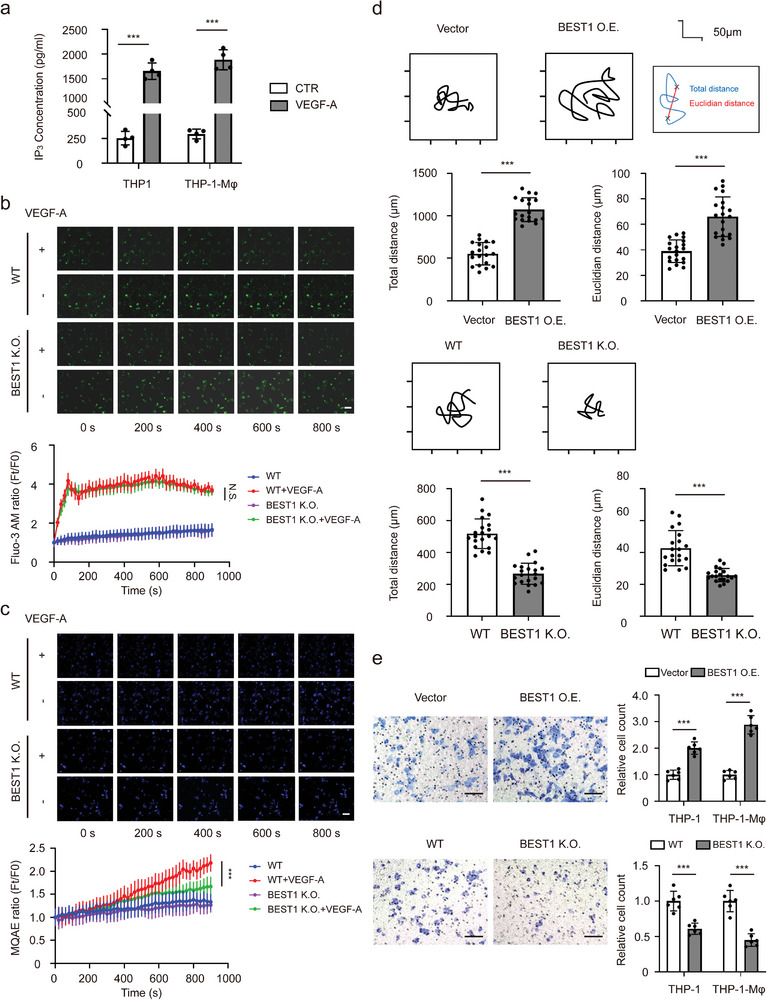
Figure 5.

BEST1 chloride channels enhance motility, and migration of monocytes and macrophages. a) THP‐1 cells/THP‐1‐derived macrophages (THP‐1‐Mφ) were treated with 100 ng mL−1 VEGF‐A for 15 min. IP3 levels in cell lysates from THP‐1 and Mφ detected by ELISA (n = 3 per group from one experiment representative of two independent experiments). b,c) Representative immunofluorescence microscopy images and quantification of Fluo‐3AM (green) (b) and MQAE (blue) (c). Scale bar, 20 µm. (n = 3 per group from one experiment representative of three independent experiments). d) Representative 12 h time‐lapse tracking plots from the blank vector (Vector) and BEST1 expression (BEST1 O.E.) (upper), or wild‐type (WT) and BEST1 CRISPR‐Cas9 (BEST1 K.O.) (lower) THP‐1 cells. Corresponding histograms quantifying motility parameters (total distance traveled per cell) (n = 20 per group from one experiment representative of three independent experiments). e) Transwell cell migration assays in THP‐1 and Mφ with Vector and BEST1 O.E. (upper), or WT and BEST1 K.O. (lower) (n = 6–8 per group from one experiment representative of two independent experiments). Data are represented as mean ± SD. Statistical significance is indicated by **p < 0.01, ***p < 0.001; Student's t‐test (a,d,e); two‐way ANOVA with Tukey's test (b,c).
