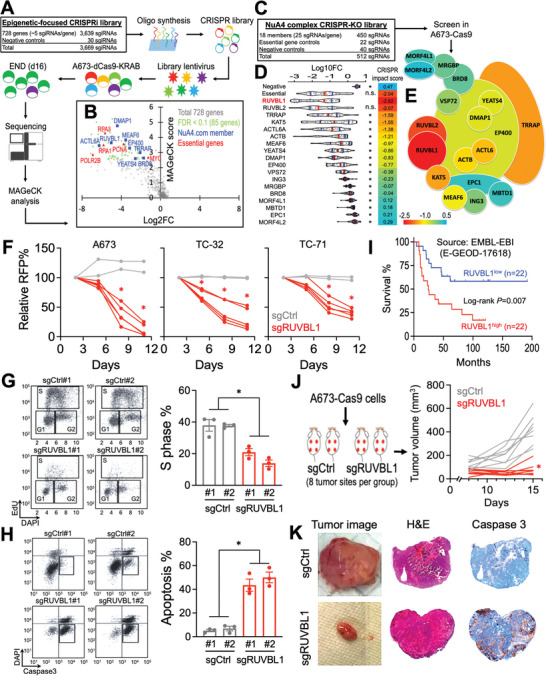
Figure 1.

Serial CRISPR screens identify the essential role of RUVBL1 in EwS. A) Schematic outline of an epigenetic‐focused CRISPRi screen in A673‐dCas9‐KRAB cells. B) Volcano plot depicts the log2 fold change of sgRNA abundance during 16 d of screen culture (x‐axis; log2FC) and the significance (y‐axis; MAGeCK score) of each gene in the epigenetics CRISPRi screen (n = 3 replicates). C) Library design of the NuA4 complex CRISPR screen in A673‐Cas9 cells. D) Violin plots indicate the median (red lines), first and third quartiles (blue lines), and the log10 fold change of individual sgRNA (dots) during 16 d of NuA4 complex CRISPR screen culture (n = 3 replicates). E) Heatmap showing the CRISPR impact scores (Log10FC of the first quartile out of 25 sgRNAs per gene) of each member in the NuA4 complex CRISPR screen. F) Growth competition assay of Cas9‐expressing A673, TC‐32, and TC‐71 EwS cells transduced with RFP‐labeled negative control sgRNAs (gray lines; n = 2 independent sgCtrl sequences) and sgRNAs targeting RUVBL1 (red lines; n = 5 independent sgRUVBL1 sequences). G) Cell cycle monitored by EdU incorporation, and H) cellular apoptosis detected by active caspase 3+/DAPI− in A673‐Cas9 cells transduced with sgCtrl and sgRUVBL1 for 7 d (n = 3 for each group). I) Survival curves of patients with EwS family of tumors expressing high versus low RUVBL1 (22 patients for each group). J) Profile plot of EwS xenograft tumor volume in mice inoculated with sgCtrl and sgRUVBL1 transduced A673‐Cas9 cells (n = 8 tumor sites per group). K) Tumor image (left), hematoxylin and eosin stain (middle), and cleaved caspase 3 stain (right; brown) of sgCtrl and sgRUVBL1 transduced A673‐Cas9 xenograft tumor. Data are represented as mean ± SEM. *P < 0.01 compared to D) RUVBL1 and F–H,J) sgCtrl by two‐sided Student's t‐test. Source data are available for this figure: SourceData F1 A, B, and D.
