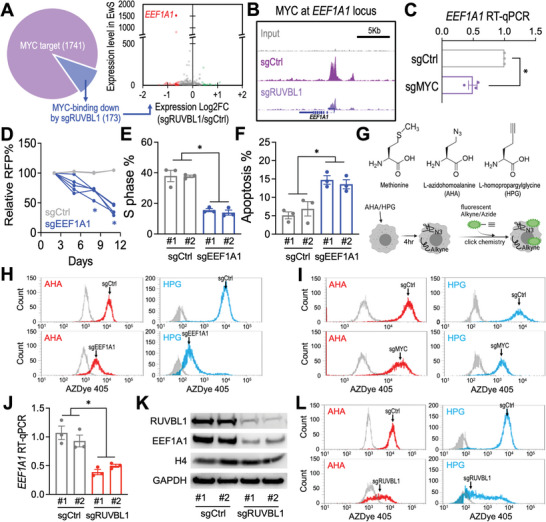
Figure 3.

RUVBL1 controls protein synthesis via mediating EEF1A1 expression. A) RNAseq evaluation of the expression level in EwS (y‐axis) and the log2 fold change of expression induced by sgRUVBL1 (x‐axis) of the RUVBL1‐regulated MYC targets (173 genes). The depleted (red) and enriched (green) genes are highlighted. B) Profiles of MYC ChIP‐seq at EEF1A1 locus in A673‐Cas9 cells transduced with sgCtrl and sgRUVBL1. C) RT‐qPCR of EEF1A1 mRNA in A673‐Cas9 cells transduced with sgCtrl and sgMYC (n = 3 for each group). D) Growth competition assay of sgCtrl (gray lines; n = 2 independent sgRNA sequences) and sgEEF1A1 (blue lines; n = 5 independent sgRNA sequences) in A673‐Cas9 cells. E) Cell cycle monitored by EdU incorporation, and F) cellular apoptosis detected by active caspase 3+/DAPI− in A673‐Cas9 cells transduced with sgCtrl and sgEEF1A1 (n = 3 for each group). G) Schematic outline of metabolic labeling of the newly synthesized proteins using AHA/HPG incorporation. Flow cytometric profiles of AHA (red) and HPG (cyan) labeled compared to the nonlabeled (gray) cells in A673‐Cas9 cultures transduced with H) sgCtrl versus sgEEF1A1, I) sgCtrl versus sgMYC, and L) sgCtrl versus sgRUVBL1. J) RT‐qPCR of EEF1A1 mRNA in A673‐Cas9 cells transduced with sgCtrl and sgRUVBL1 (two independent sgRNA sequences; n = 3 for each group). K) Western blot of RUVBL1, EEF1A1, histone H4, and GAPDH in A673‐Cas9 cells transduced with sgCtrl and sgRUVBL1 (two independent sgRNA sequences per group). Data are represented as mean ± SEM. *P < 0.01 compared to sgCtrl by two‐sided Student's t‐test.
