
Figure 7.
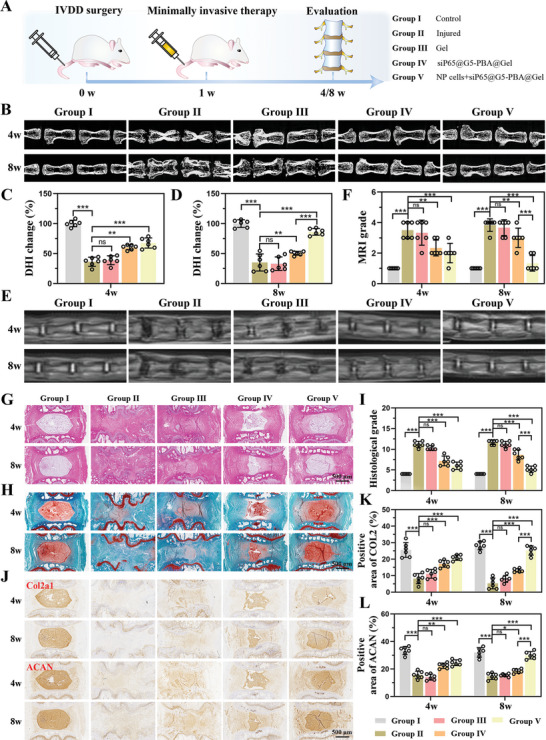
In vivo evaluation of IVD regeneration by siP65@G5‐PBA@Gel combined with cell therapy. A) Schematic illustration showing the overall procedure of the in vivo experiment. B) Micro‐CT images of rat coccygeal vertebrae discs in different groups at 4 and 8 weeks postoperative. Quantitative DHI changes according to micro‐CT images at C) 4 weeks (n = 6 discs) and D) 8 weeks (n = 6 discs) postoperative. E) MRI images and F) quantitative MRI grade of IVDs in different groups at 4 and 8 weeks postoperative (n = 6 discs). G,H) H&E, safranin O, and fast green staining of IVDs in rats at 4 and 8 weeks postoperative (scale bar = 500 µm). I) Changes in the histological grades at 4 and 8 weeks postoperative (n = 6 discs). J) Immunohistochemistry images of Col2a1 and ACAN at 4 and 8 weeks postoperative (scale bar = 500 µm). K,L) Quantitative positive areas of Col2a1 and ACAN analyzed by Image J (n = 6 discs). The values presented are the mean ± SD. * p < 0.05; ** p < 0.01; *** p < 0.001; ns, not statistically significant. Statistical significance was assessed by one‐way ANOVA with a post‐hoc Tukey test for (C,D,K,L), and by the Kruskal–Wallis H test for (F,I).