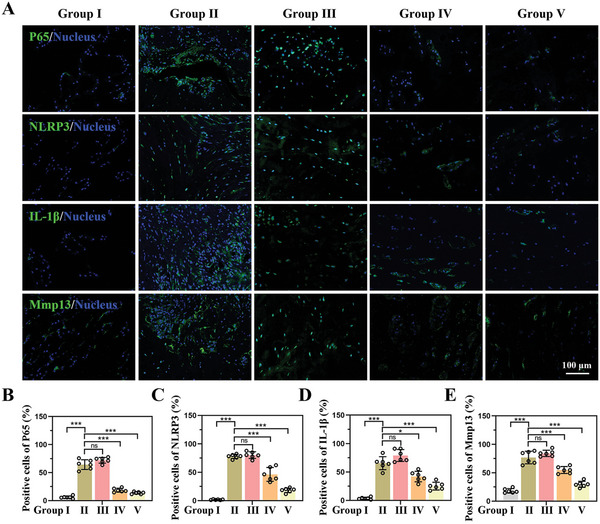
Figure 8.

Underlying mechanism of the siP65@G5‐PBA@Gel combined with cell therapy for IVD regeneration in vivo. A) IF images of the P65, NLRP3, IL‐1β, and Mmp13 expression in different groups at 8 weeks postoperative (scale bar = 100 µm). B–E) Quantitative positive cells of P65, NLRP3, IL‐1β, and Mmp13 analyzed by Image J (n = 6 discs). The values presented are the mean ± SD. * p < 0.05; *** p < 0.001; ns, not statistically significant. Statistical significance was assessed by one‐way ANOVA with a post‐hoc Tukey test for (B–E).
