Figure 6.

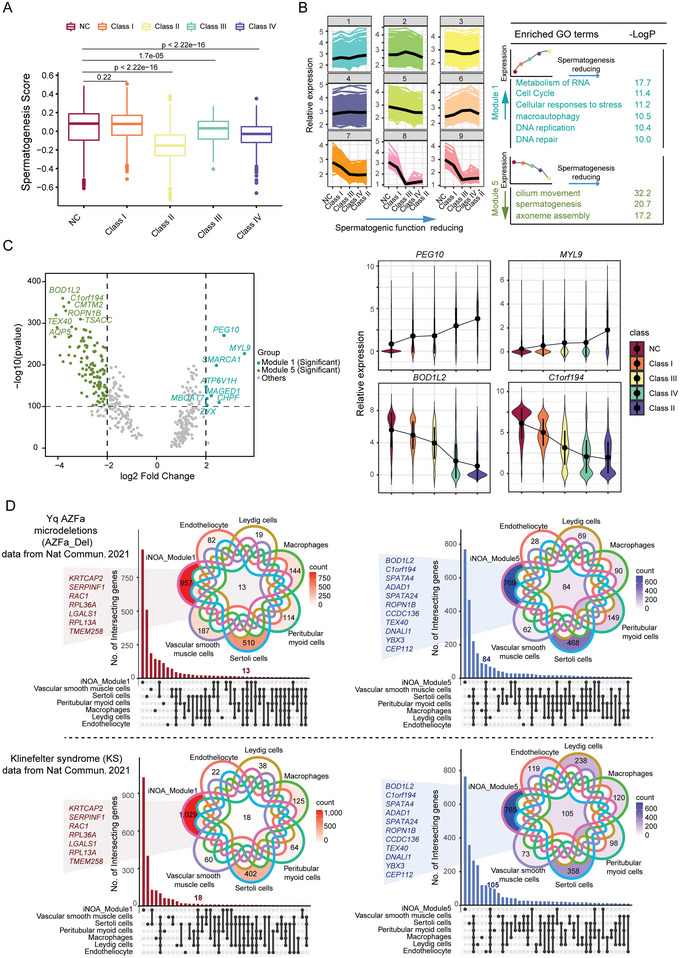
Identification of genes predicting testicular spermatogenic capacity. A) Spermatogenesis scores of each type of idiopathic nonobstructive azoospermia (iNOA). The two‐tailed Mann–Whitney–Wilcoxon test was used to assess significance. B) Ranking of normal controls (NC) and the four classes iNOA based on spermatogenesis scores. Trend genes related to ranking and associated GO terms. Module 1 includes genes whose expression increased with reducing spermatogenic capacity; Module 5 includes genes whose expression decreased with reducing spermatogenic capacity. C) Volcano plot showing the most significantly up/downregulated genes with testicular spermatogenic capacity. Line plot showing gene expression trends. D) Comparison of iNOA trend genes and differentially expressed genes (DEGs) in other testicular diseases, such as Y‐chromosome microdeletions and Klinefelter syndrome. On the left is the Module 1 gene compared to DEGs that are upregulated in testicular diseases; on the right is a comparison of the Module 5 gene with DEGs downregulated in testicular diseases. The X axis represents the intersection of module genes and DEGs in testicular diseases, compared to NC. The Y axis is the number of intersecting genes.
