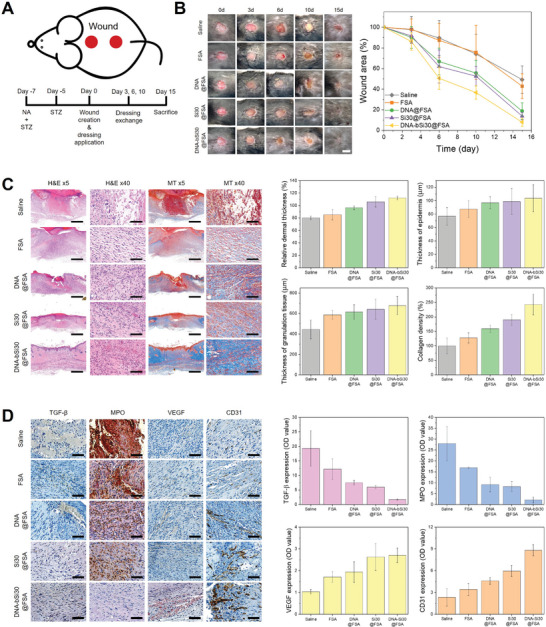
Figure 7.

A) Schematic diagram and timeline of the in vivo diabetic‐wound healing experiments. B) Captured images of the wound area after the determined breeding time, and wound‐closing rate calculated from the obtained images (scale bar: 5 mm). C) Histological images of H&E‐ and MT‐stained tissues, and computed relative dermal thickness, epidermal thickness, granulation tissue thickness, and collagen density (scale bar: 500 µm for 5× magnification and 50 µm for 40× magnification). D) Immunohistochemical analysis of the extracted tissues for visualizing the degree of inflammation (TGF‐β and MPO) and angiogenesis (VEGF and CD31) (scale bar: 50 µm).
