FIGURE 2.

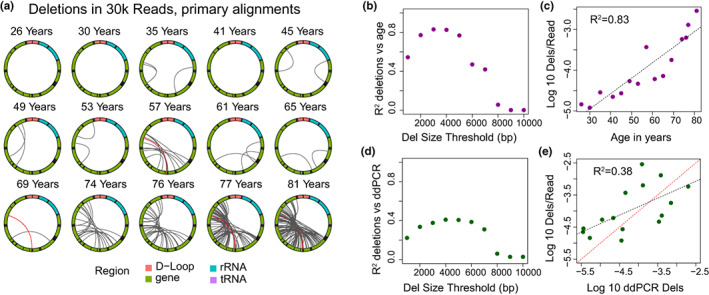
Large mtDNA deletions in primary alignments. (a) Localization of deletions >2000 bp identified in CIGAR sequence of primary alignments in a random subset of 30,000 reads per sample. The mitochondrial genome is depicted in a clockwise orientation with lines linking the start and end of each identified deletion. The human mitochondrial “common” deletion is highlighted in red where identified. (b) R 2 correlation coefficient for log‐transformed number of identified deletions per mitochondrial read versus age plotted versus the minimum deletion size cutoff used in calculating correlation. (c) Log‐transformed frequency of deletions >3 kbp per mitochondrial read versus age. (d) R 2 correlation coefficient for log‐transformed number of identified deletions per mitochondrial read versus log‐transformed deletion frequency by ddPCR plotted versus the minimum deletion size cutoff used in calculating correlation. (e) Log‐transformed frequency of deletions >3 kbp per mitochondrial read versus log‐transformed ddPCR deletion frequency. The red dashed line is the line of identity.
