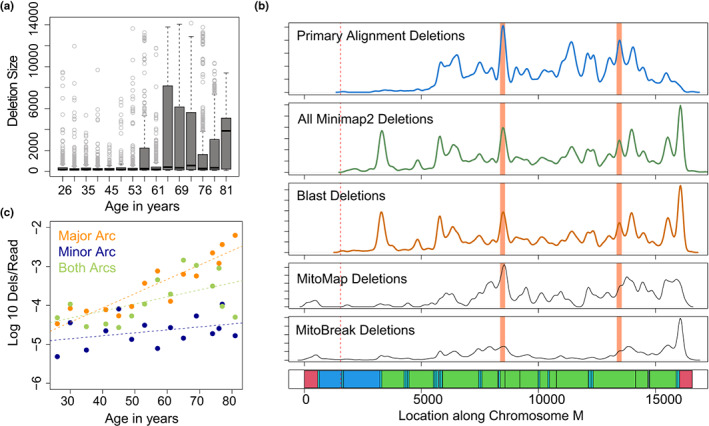
FIGURE 4.

Distribution of mtDNA deletions across the mitochondrial genome. (a) Boxplots depicting the distribution of mtDNA deletion size versus age of sample. (b) Density of deletion breakpoints identified using primary alignment algorithm (blue), combined Minimap2 deletions (green) and blast alignment deletions (dark orange) as compared to all deletion breakpoints reported in MitoMap (Lott et al., 2013) and MitoBreak (Damas et al., 2014) databases. Bottom panel shows annotation of the mitochondrial genome. D‐loop regions shown in red, rRNA shown in dark blue, tRNA shown in light blue, coding regions shown in green. Cas9 cut site shown in dotted lines. Location of human common deletion breakpoints shown in light red rectangles. (c) Log‐transformed frequency of deletions >2 kbp per mitochondrial read versus age, plotted separately for deletions contained entirely within the minor arc (dark blue) entirely within the major arc (orange), or involving both arcs (green).
