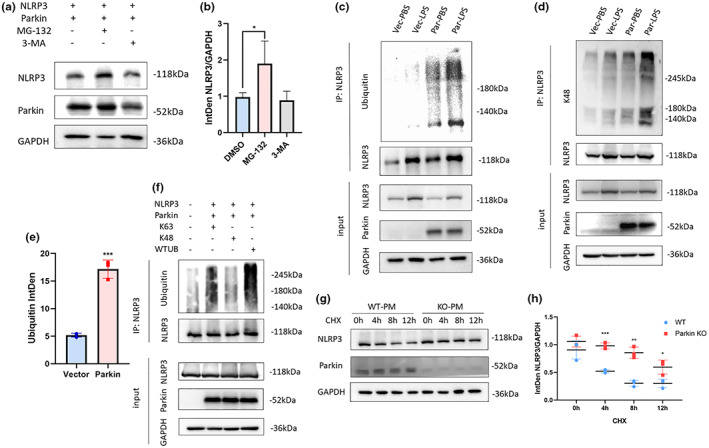
FIGURE 3.

(a, b) Influence of two inhibitors, MG‐132, and 3‐MA on 293 T cells transfected with a Parkin and NLRP3 expression plasmid (a). Statistical analysis of NLRP3 levels in MG‐132, 3‐MA groups (b). (c–e) IP of NLRP3 in BV2 cells. Ubiquitination levels measured using a ubiquitin antibody (c) and a K48‐linked ubiquitin antibody (d). Statistical analysis of anti‐ubiquitin bands (e). (f) IP of NLRP3 in 293 T cells transfected with a different ubiquitin plasmid. (g, h) cycloheximide chase experiment on WT and Parkin KO primary microglia. Degradation speed was faster in WT group than in Parkin KO group (g), Statistical analysis showed difference at 4, 8, and 12 h time points (h). 3‐MA, 3‐methyl adenine; IP, immunoprecipitation; KO, knockout; NLRP3, NOD‐, LRR‐ and pyrin domain‐containing 3; WT, wild type. *p < 0.05, **p < 0.01, ***p < 0.001.
