
FIGURE 5.
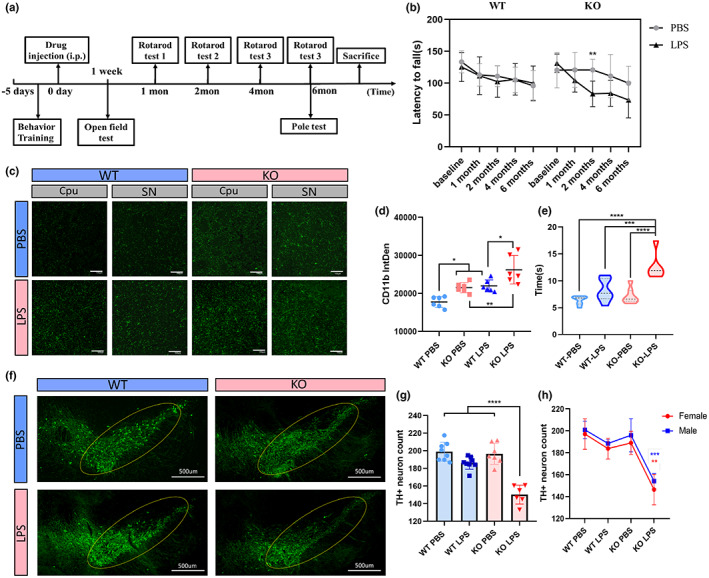
Neuroinflammation and PD‐related pathology 6 months after LPS treatment. 16 WT (8 males and 8 females) and 16 Parkin KO (8 males and 8 females) mice were divided into four groups (equal sex distribution): WT‐PBS, WT‐ LPS, KO‐PBS, KO‐LPS. Two in KO‐LPS group and one in KO‐PBS group died during the experiment and were excluded. (a) Schematic representation illustrating the experimental design (timeline). (b) Latency to fall in the Rotarod test at 6 months. (c, d) CD11b staining of brain sections of mice and integrated density of CD11b levels. Each dot represents the SNc or striatum region of one mouse. Scale bar: 100 μm. (e) Time required to reach the bottom of the pole from the top at 6 months post‐LPS injection. (f–h) TH staining in the SNc of the brains of mice. The yellow circle indicates the SNc. Quantification of the relative number of TH‐positive cells in the SNc, as determined for the whole group (g) and separately for each sex (h), although the results are the same. Each dot represents a mouse. Scale bar: 100 μm (c), 500 μm (f). KO, knockout; LPS, lipopolysaccharide; PD, Parkinson''s disease; SNc, substantia nigra pars compacta; TH, tyrosine hydroxylase; WT, wield type. *p < 0.05, **p < 0.01, ***p < 0.001, ****p < 0.0001.