
FIGURE 2.
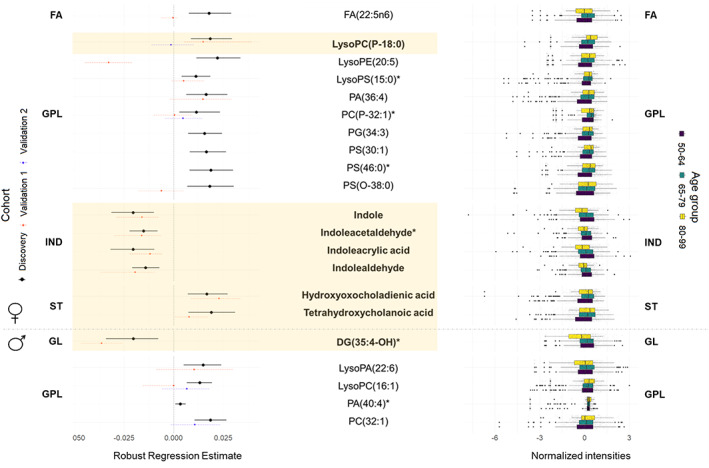
Gender‐specific plasma metabolic species associated with age. Those features validated in independent cohorts are highlighted in bold and in yellow shade. Left panel: Forest plot of the significant (FDR p‐value < 0.05) robust linear regression results for the association between the relative abundance of each metabolite (log‐transformed and z‐scored) and age for each gender, adjusted by weight, height, body mass index, systolic and diastolic pressure, antecedents of depression, hypertension, dyslipidemia, cardiac insufficiency, renal disease, atrial fibrillation, COPD, tobacco consumption and STAI state, as well as serum glucose, total cholesterol and HDL and LDL cholesterol levels in the Discovery cohort. Dots represent the robust linear regression estimates for age, and the whiskers represent bootstrapped 95% confidence intervals. Colors represent the cohort used for the regression (Black: Discovery, Orange: Validation cohort 1, Blue: Validation cohort 2). Four negative correlations (all of them validated) and 12 positive correlations (3 of them validated) were found in women, and 1 negative correlation (validated) and 4 positive correlations (none of them validated) were found in men. Right panel: Boxplots of the metabolites stratified by age groups (purple: 50–64 years old, blue: 65–79 years old, yellow: 80–99 years old). DG, Diacylglyceride; FA, Fatty Acyls; GPL, Glycerophospholipids; IND, Indoles; PA, Phosphatidic acid; PC, Phosphocholine; PE, Phosphoethanolamine; PG, Phosphoglycerol; PS, Phosphoserine; ST, Steroids and steroid derivatives. All metabolites were identified based on exact mass, retention time and MS/MS spectrum, except those with (*) that were only identified based on exact mass and retention time.