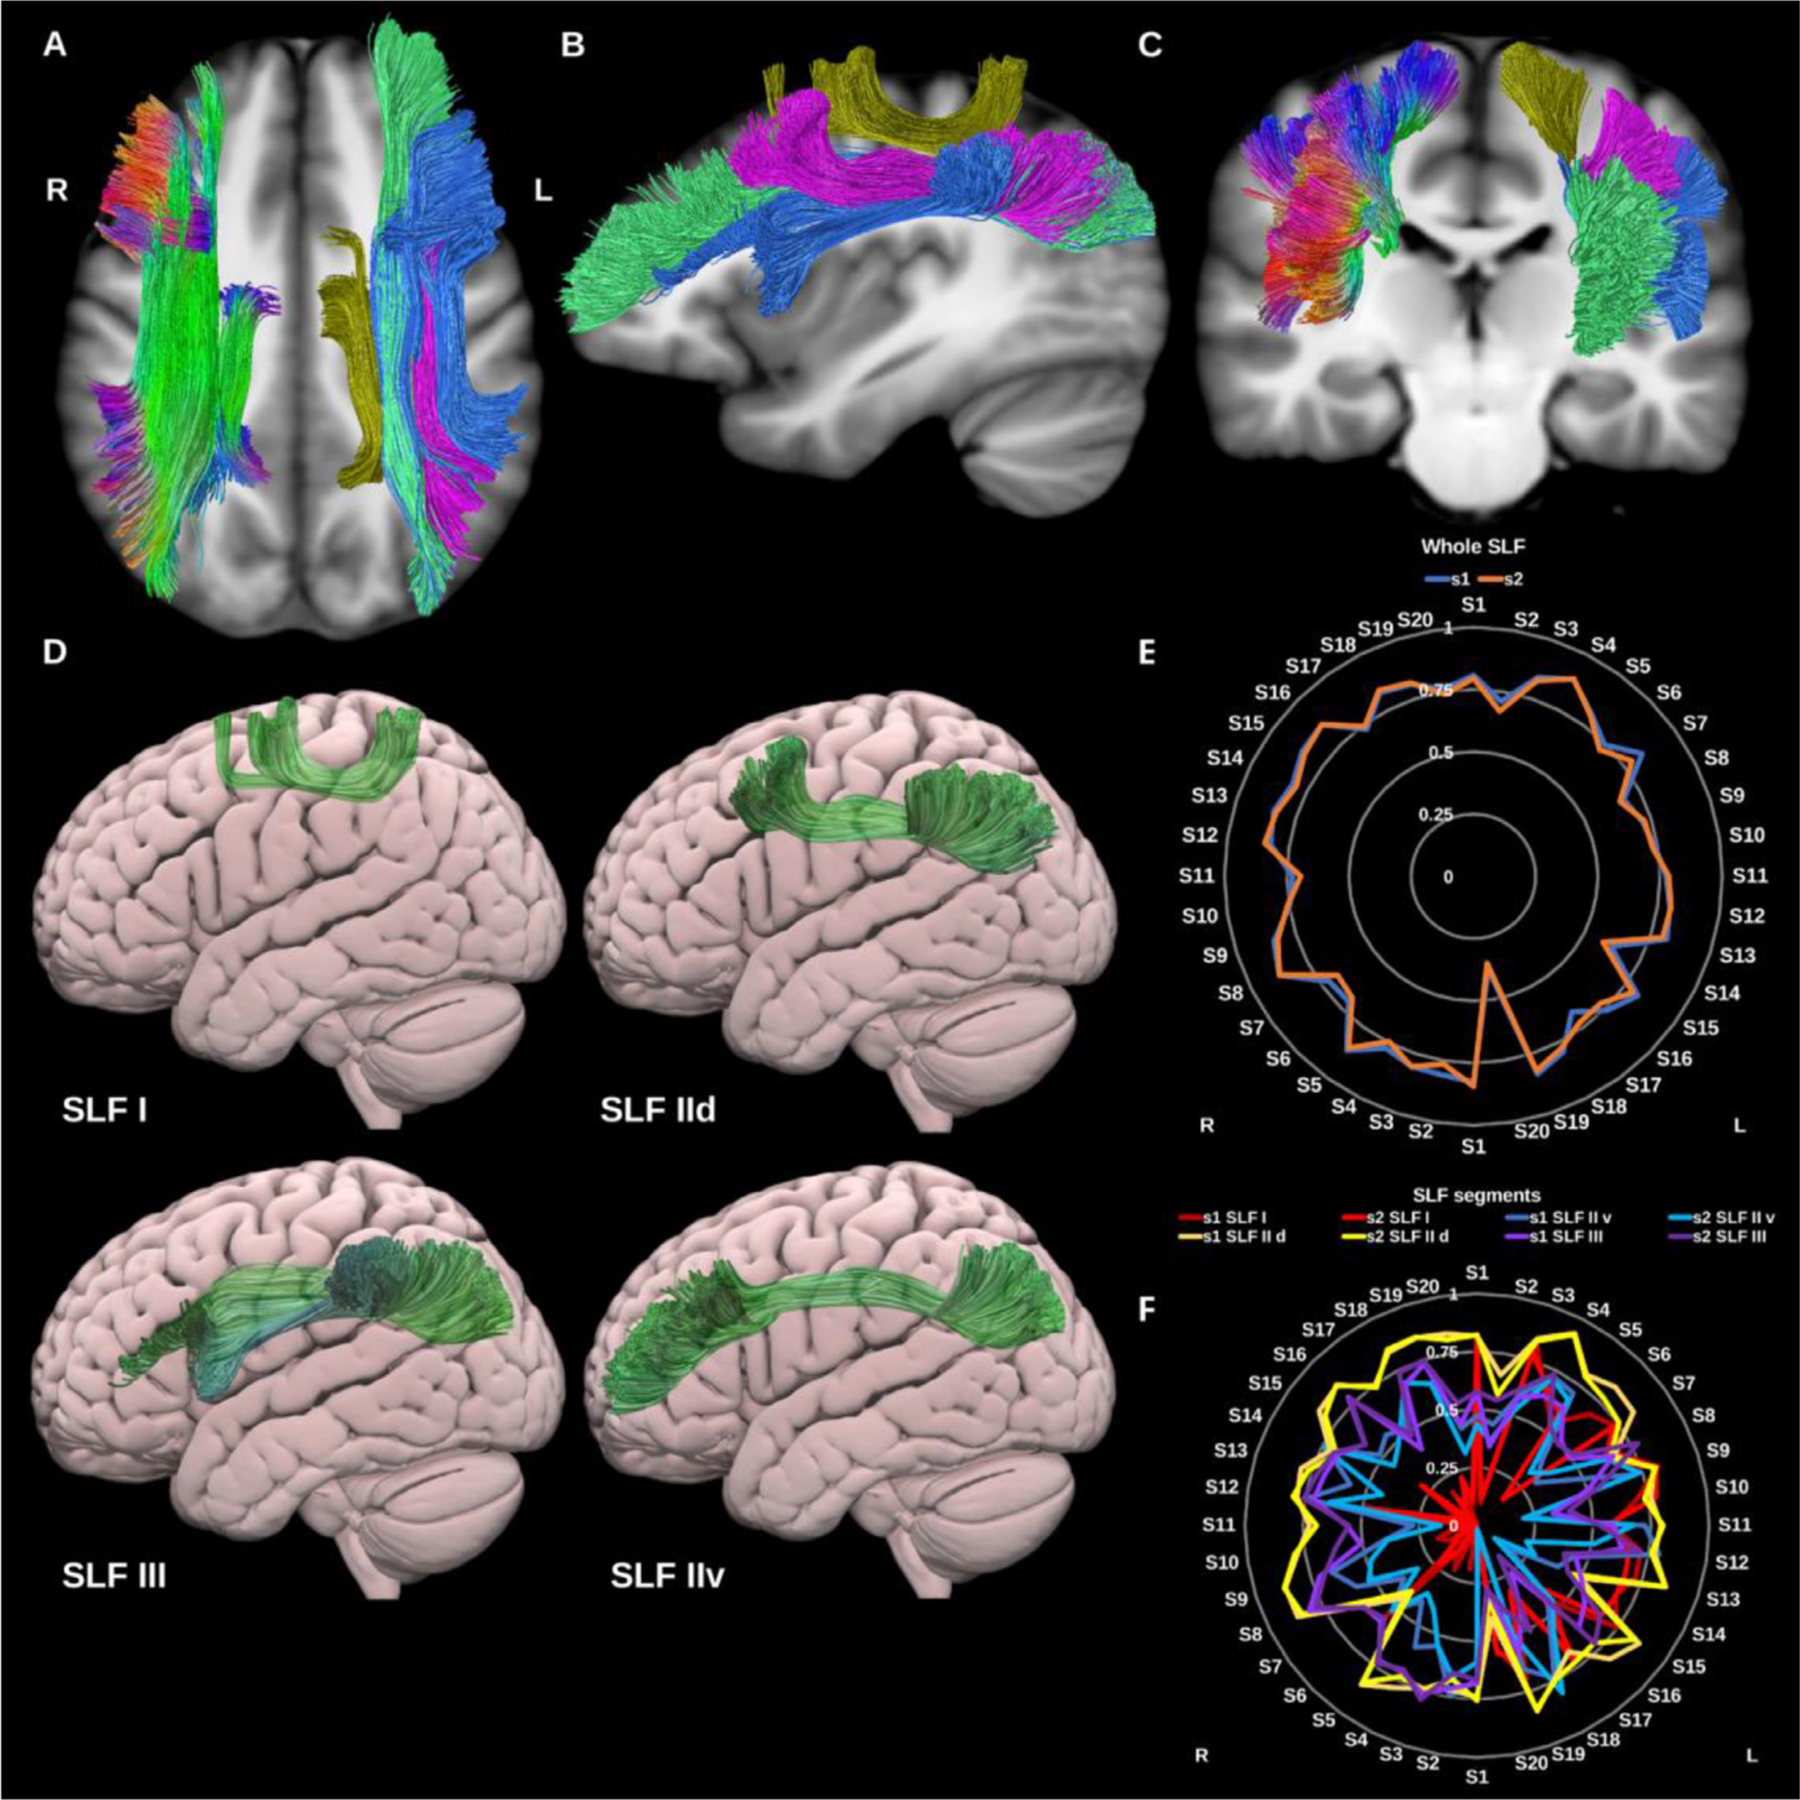
Fig. 9.

(A), (B), and (C) Superior longitudinal fasciculi (SLF) overlaid in directional color coding on the right side and in gold (SLF-I), pink (SLF-IId), green (SLF-IIv) and blue (SLF-III) on the left side on sagittal and axial slices of T1-weighted images. (D) 3D lateral projections of the semitransparent MNI pial surface with the left SLF I, IId, IIv, and III in green. (E) and (F) Radar plots of the wDSC scores (vertical range) of both whole SLFs (E) reconstructed using first session (blue) and second session (orange), and SLF components (F) for each side. L = left, R = Right, S = subject, MNI= Montreal Neurological Institute, wDSC= weighted dice similarity coefficient.
