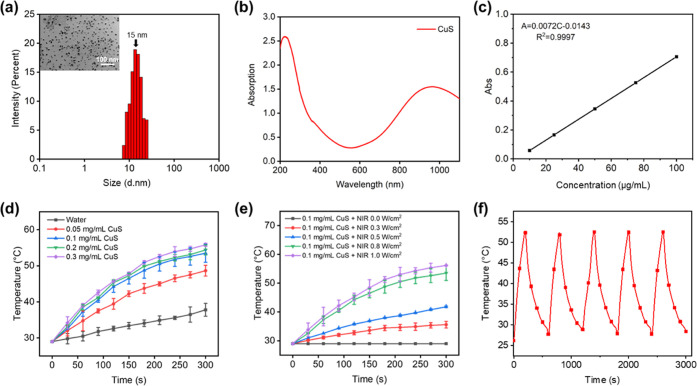
Figure 1.
Characterization of CuS nanoparticles. (a) TEM image of CuS with size distribution. (b) UV–vis–NIR absorption spectra of CuS. (c) Standard equation of CuS solution in the concentration range of 0.1–1 mg/mL. (d) Temperature change with CuS concentrations under infrared light irradiation at 980 nm and a power of 1.0 W/cm2. (e) Temperature change over time of CuS solutions (0.1 mg/mL) with different irradiation powers (0–1 W/cm2) at 980 nm. (f) Continuous heating and cooling curve of a CuS solution (1 W/cm2).

