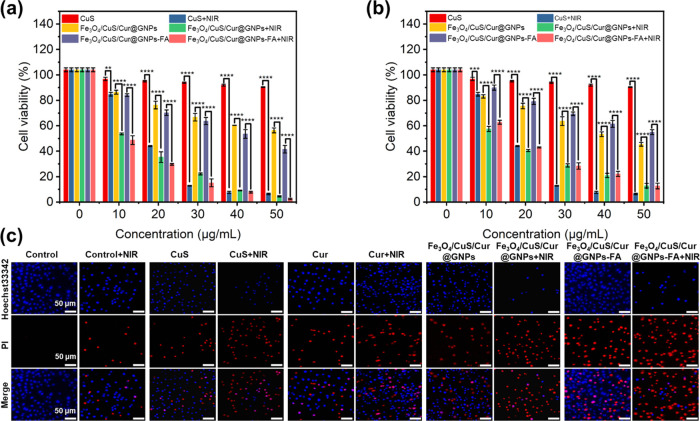
Figure 6.
Cytotoxicity of different concentrations of pharmaceutical formulations to MCF-7 cells (a) and A549 cells (b) under NIR light. (n ≥ 3;NIR,1.0 W/cm2; ****P < 0.0001; ***P < 0.001; **P < 0.01; and *P < 0.05). (c) Live/dead staining of MCF-7 cells, where blue- and red-dyed cells represent live and dead cells at 24 h, respectively.

