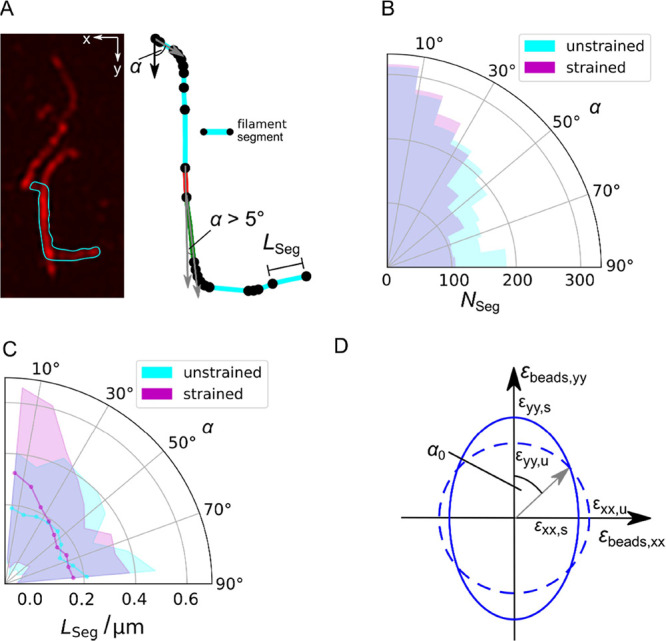
Figure 5.

Analysis of the reorientation of membrane-bound VIFs upon stretching. (A) (left) Fluorescence micrograph of individual VIFs in a loose network, where one filament is highlighted (cyan) that was used for segmentation (right). A new segment of a filament starts (black dot), where the angle α defined between the nth and (nth + 1) orientational vector changes by more than 5°. Scale bar: 2 μm. (B) Distribution of the orientation angles α of the VIF segments NSeg (polar histogram) on PDMS-supported membranes (NVIFs = 86). α was obtained by determining the angle between the nth and (nth + 1) orientational vector (gray vectors, (A)) starting with the vector in the y-direction (black vector, (A)). (C) Distribution of the orientation angles α of the average VIF segment lengths LSeg (solid line, cyan and magenta) with errors (STD, shades) (polar histogram) on PDMS-supported membranes (N = 86). (D) Determination of the theoretical α0 for the uniaxial stretcher. The unstretched state is represented as a circle (dashed line), and the stretched state is given as an ellipse (solid line) considering εbeads,yy and εbeads,xx at mp = 10 mm (see Figure 2C). α0 is defined between the y-axis and the vector pointing at the intersection of the circle and ellipse resulting in α0 = 50°.
