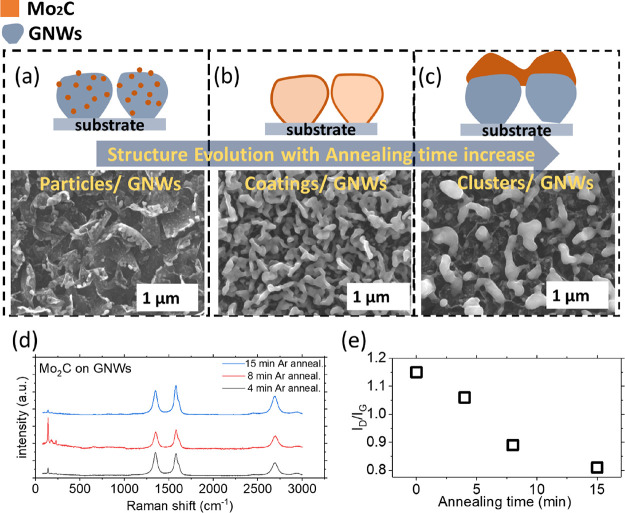
Figure 3.
SEM images (lower) of Mo2C formed on GNWs after (a) 4 min, (b) 8 min, and (c) 15 min of annealing and illustrations of the resulting nanostructures (upper). (d) Raman spectra of Mo2C formed on GNWs after 4, 8, and 15 min of annealing. (e) Graph of the ID/IG ratio as a function of annealing time.

