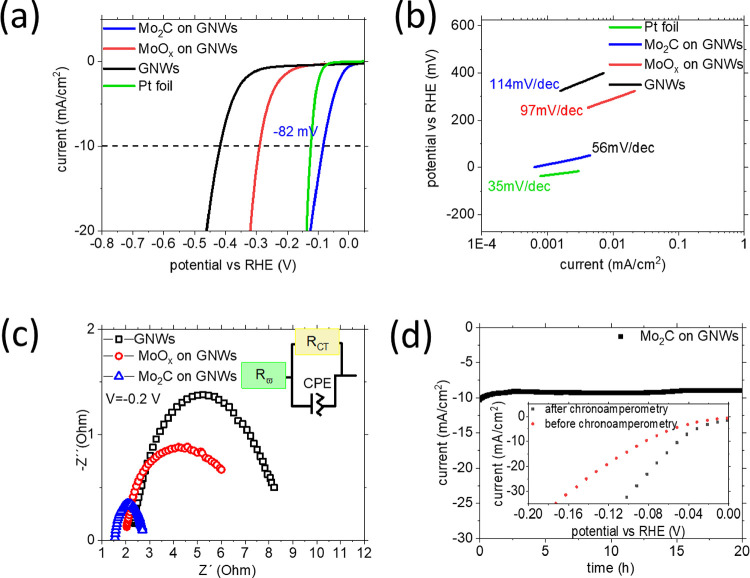
Figure 6.
(a) LSV curves of Mo carbide (blue), as-deposited Mo (red), and bare GNWs on Papyex. (b) Tafel slopes produced from the LSV curves. (c) EIS curves of the electrodes. (d) Chronoamperometry test during 20 h under −85 mV continuous bias and (inset) LSV curves comparing the catalytic activity before and after the endurance test.

