Figure 1.
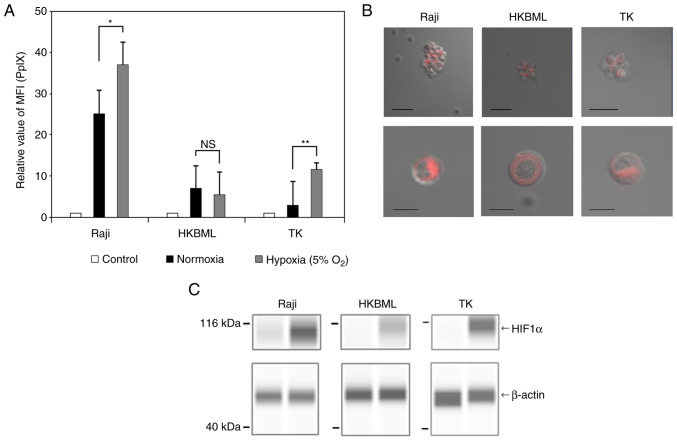
Intracellular accumulation and visualization of 5-ALA-induced PpIX in lymphoma cells. The intracellular PpIX fluorescence in lymphoma cells was determined using flow cytometry. Lymphoma cells were treated with 0.3 mM 5-ALA and incubated for 4 h. Hypoxic conditions were induced by placing cells in a multi-gas incubator (5% O2) for 24 h before the treatment with 5-ALA, and expression analysis of HIF1α. (A) The relative MFI of 5-ALA-induced PpIX fluorescence was relative to that of 5-ALA-untreated cells in each cell line, and the relative MFI of 5-ALA-induced PpIX was compared under normoxic and hypoxic conditions. The control group was treated without 5-ALA under normoxic conditions. Columns, mean (n=8); error bars, SE. (B) Visualization of intracellular PpIX in the lymphoma cells treated with 1.0 mM 5-ALA for 4 h using a confocal laser scanning microscope (excitation, 488 nm; emission, 630-nm long-pass filter). Scale bar, 50 µm (top row) or 10 µm (bottom row). (C) Expression analysis of HIF1α in lymphoma cells. HIF1α and β-actin were detected using capillary western blotting, and the results are shown as capillary western lane view images which were obtained using the Simple Western system. *P<0.05; **P<0.01. 5-ALA, 5-aminolevulinic acid; HIF1α, hypoxia-induced factor 1α; MFI, median fluorescence intensity; NS, not significant; PpIX, protoporphyrin IX.

