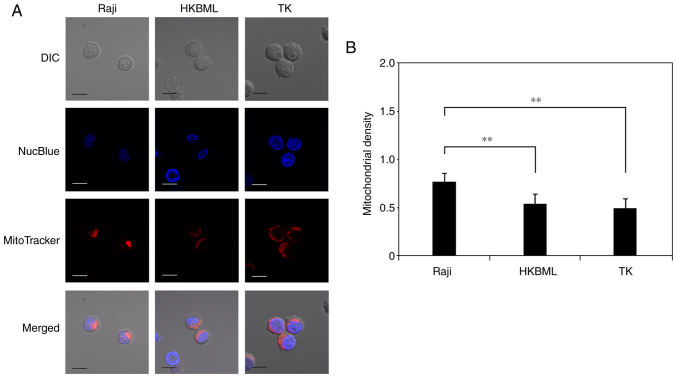
Figure 4.
Evaluation of the mitochondrial density in lymphoma cells. (A) Visualization of nuclei and mitochondria in lymphoma cells using a confocal laser scanning microscope. Cells were treated with NucBlue to identify the nuclei and with MitoTracker to identify mitochondria. The merged image included the NucBlue fluorescence and MitoTracker fluorescence staining, and the DIC image. Scale bar, 10 µm. (B) Mitochondrial density in lymphoma cells as determined using microdensitometric analysis using ImageJ. Columns, mean (n=4); error bars, SE. **P<0.01. DIC, differential interference contrast.

