Fig. 1.
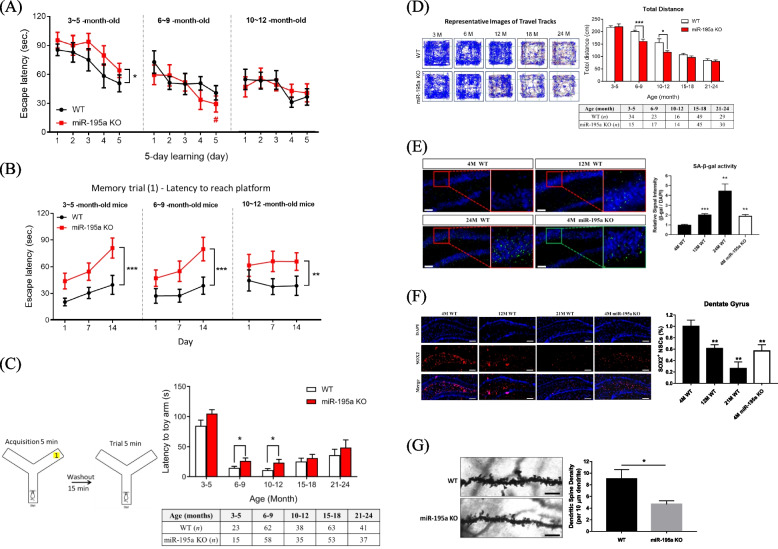
miR-195a KO mice present cognitive impairments and neurodegenerative features. A-B Learning and spatial memory were evaluated by the Morris Water Maze test (MWM) in miR-195a KO and age-matched WT mice. A Longer escape latency to reach the hidden platform indicates lower learning ability. Significant results from one-way repeated measures ANOVA for each type of mice are indicated by pound signs (#), and from two-way repeated measures ANOVA for comparison between KO and WT mice indicated by asterisk signs (*). B Longer escape latency to reach the platform indicates worse memory. Two-way repeated measures ANOVA yielded that KO had worse memory than age-matched WT mice. C The Y-maze test assesses working memory by measuring the time to reach the arm of the novel toy. Quantitative data is in the right panel. D Locomotor function was measured by the open field test. The representative images (left panel) show the traveled tracks of WT and miR-195a KO mice in the open field. The quantitative data are in the right panel. E Senescence-associated ß-galactosidase (SA-ß-gal) stain in the hippocampus. The representative images in the left panel show hippocampal senescent cells (green). Scale bar = 100 μm (n = 3/each group). F miR-195a KO mice had reduced NSC population than did age-matched WT mice. Representative images show SOX2 + (red) NSCs in the hippocampal dentate gyrus (DG) of WT mice and miR-195a KO mice (n = 3/group). Magnification: 20X. Scale bar = 200 μm. G Decreased dendritic spine density in miR-195a KO mice. Representative images of apical dendritic shaft of CA1 pyramidal neurons from 4-month-old miR-195a KO mice and age-matched WT mice (n = 3 mice/group; 15 neurons/mice). Scale bar = 5 μm. Figure 1A: #p < 0.05 verse first-day escape latency of the same mice type. *p < 0.05, **p < 0.01, *** p < 0.001

