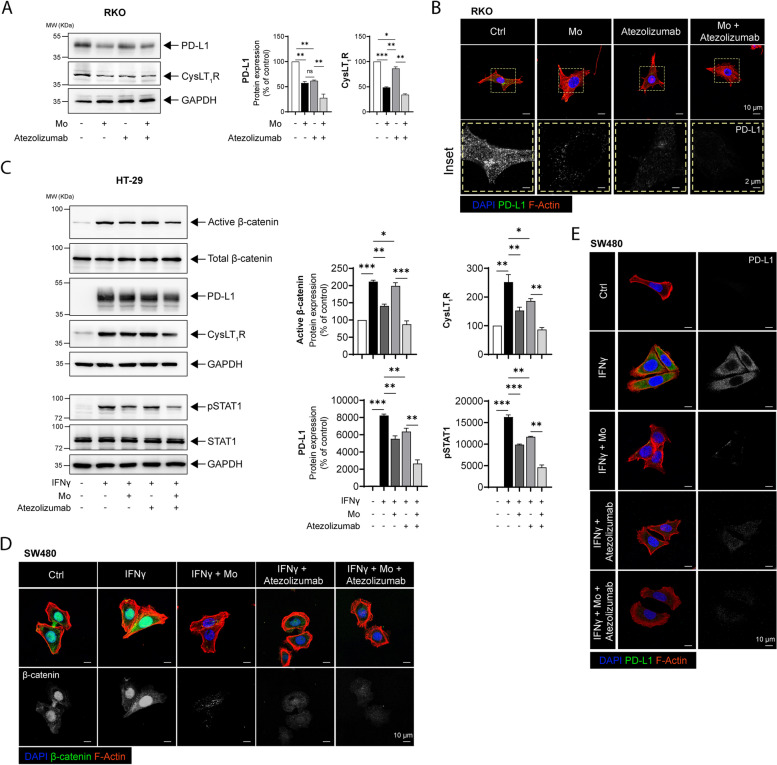
Fig. 4.
The CysLT1R-specific antagonist Mo shows combinatorial effects with an anti-PD-L1 neutralizing antibody. A Western blots showing the expression of the indicated proteins in RKO CC cells treated with Montelukast (Mo, 10 µM) or Atezolizumab (20 ng/mL) alone or together. The blots are representative of three replicates, and the results are shown in the densitometry graphs. B Immunofluorescence images showing PD-L1 expression in RKO cells. Cells were stimulated with Mo (10 µM) for 30 min or Atezolizumab (20 ng/mL) for 24 h alone or in combination with pretreatment with Mo (10 µM, 30 min) followed by Atezolizumab ( 20 ng/mL) for 24 h. The left panel shows the merged confocal images in each group with nuclear staining (DAPI, blue), PD-L1 staining (pseudocolored, green), and cytoskeleton staining (phalloidin, red), and the right column (insets) shows PD-L1 expression alone (grayscale) magnified from the region of interest marked by the yellow dotted line. The scale bars are indicated in the micrographs. C Western blots showing the expression of the indicated proteins in IFNγ-stimulated (50 ng/mL, 24 h) HT-29 cells subsequently treated with Mo or Atezolizumab alone or together (Mo + Atezolizumab). The blots are representative of three replicates, and the results are shown in the densitometry graphs. Immunofluorescence images showing the protein levels of D PD-L1 and E active β-catenin in IFNγ-stimulated SW480 cells subsequently treated with Atezolizumab alone or together with Montelukast (Mo + Atezolizumab). Bars, 10 µm. In all western blot panels, GAPDH served as the loading control. MW, relative molecular weight expressed in kilodaltons (kDa). Mean ± SEM. *P < 0.05, ***P < 0.001, two-tailed unpaired t test

