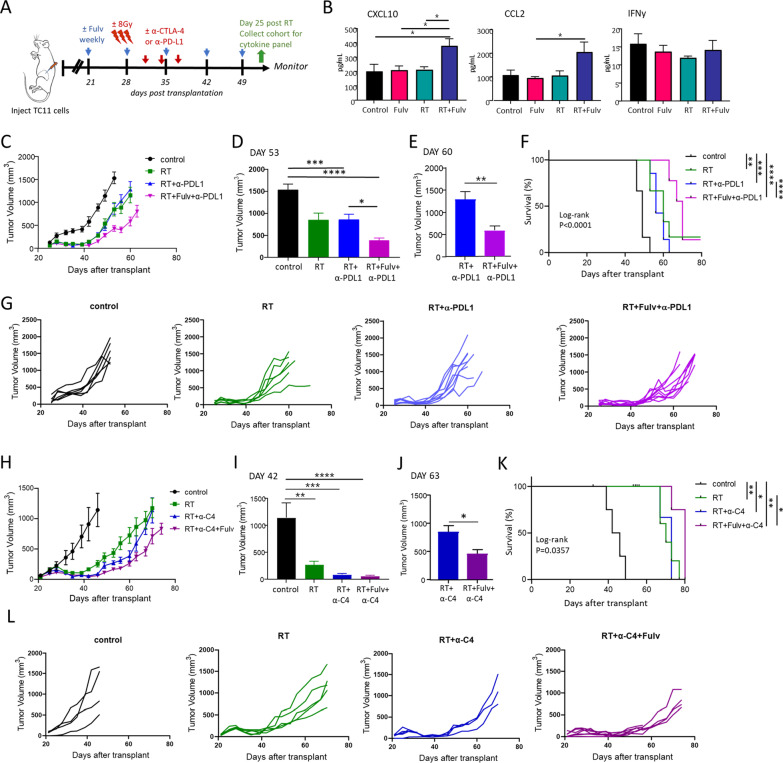
Fig. 6.
Fulvestrant in combination with RT improves the response to α-PDL1 and α-CTLA4, although tumor growth eventually resumes. A Schematic of treatment timeline. Three weeks after transplantation, treatment with fulvestrant (Fulv) or oil control was initiated. Beginning day 6 after initiation of Fulv/ vehicle treatments, tumors were administered ± 3 doses of RT (8 Gy) on three consecutive days (days 27, 28, and 29 after transplantation). After two additional days, three doses of ICIs (α-PDL1 or α-CTLA-4) were administered (days 31, 34 and 37 after transplantation). Tumors from one cohort of animals were collected on day 53 post transplantation (day 25 after RT, green arrow). Remaining mice were euthanized at end stage. B Levels of intratumoral cytokines 25 days after RT were determined by multiplex immunoassays (see also Additional file 2 Fig. S4). (Mean ± SEM, n = 5). Differences among treatments were determined by one way ANOVA, followed by Tukey post tests. *, p < 0.05. C-F Fulvestrant further slows growth of tumors and increases survival of mice co-treated with RT+α-PDL1. (N.B.: additional single and dual treatment response data are shown in Figs. 1 and 2). C Tumor volumes (mean ± SEM; n = 6 for single treatments, n = 9 for combination treatments). D Comparison of tumor sizes in mice receiving treatments in (C) at day 53 post transplantation, the latest time point when no animals had reached end stage. Differences among treatments were determined by one way ANOVA, followed by Tukey post tests. *, p < 0.05; ***, p < 0.001; ****, p < 0.0001. E Comparison of tumor sizes in mice receiving treatments in (C) at day 60 post transplantation, the latest time when animals receiving RT+α-PDL1 and RT+Fulv+α-PDL1 were alive. Differences between treatments were determined by unpaired t test. **, p < 0.01. F Kaplan Meier analysis of survival (log-rank tests, **, p < 0.01; ***, p < 0.001; ****; p < 0.0001). G Tumor growth curves in individual mice shown in (C). H–L Fulvestrant increases survival of mice co-treated with RT+α-CTLA-4 (α-C4). (N.B.: additional single and dual treatment response data are shown in Figs. 1 and 2). H Tumor volumes (mean ± SEM; n = 5 for all treatment groups except RT+α-C4+Fulv, where n = 7). I Comparison of tumor sizes receiving each treatment in (H) at day 42, the latest time point when no animals had reached end stage. Differences among treatments were determined by one way ANOVA, followed by Tukey post tests. **, p < 0.01; ***, p < 0.001; ****, p < 0.0001. J Comparison of tumor sizes receiving treatments in (H) at day 63 post transplantation, the latest time point when the majority of animals receiving RT+α-C4 and RT+Fulv+α-C4 were alive. (RT+α-C4, n = 3; RT+Fulv+α-C4, n = 4). Differences between treatments were determined by unpaired t test. *, p < 0.05. K Kaplan Meier analysis of survival (log-rank tests, *, p < 0.05; **; p < 0.01. RT+α-C4 vs. RT+α-C4+Fulv, p = 0.0502). L Tumor growth curves in individual mice shown in (H)

