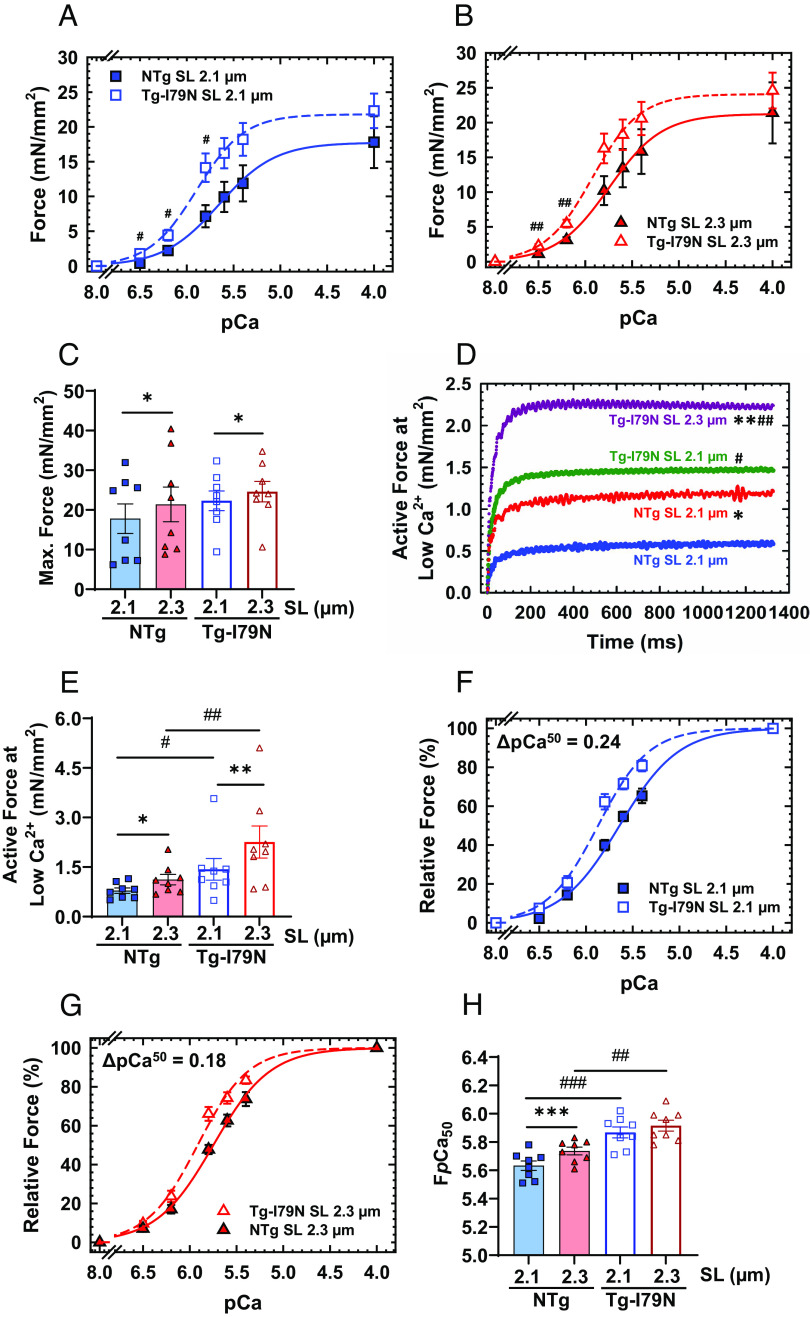
Fig. 2.
Effects of the cTnT-I79N variant on length dependence of Ca2+ sensitivity. (A and B) pCa-force curves at different SL (2.1 µm and 2.3 µm). Force levels are normalized to the cross-sectional area of the cardiac muscle preparations. (C) Maximal steady-state isometric force values at different SLs. (D and E) Absolute active force levels at low Ca2+ levels (pCa 8). Absolute force values were normalized by the cross-sectional area of the cardiac muscle preparation. (F and G) pCa-relative force plots at different SLs: The force levels are relative to the maximum steady-state isometric force exhibited by each fiber. (H) Myofilament Ca2+ sensitivity response upon muscle stretch. Data are shown as average (AVG) ± standard error (SE) (NTg, n = 8; Tg-I79N, n = 8); statistical significance was determined using Student’s t test or one-way ANOVA with Tukey’s post-hoc analysis; *P < 0.05, **P < 0.01, ***P < 0.001 within the same genotype, and #P < 0.05, ##P < 0.01, ###P < 0.01 between genotypes.

