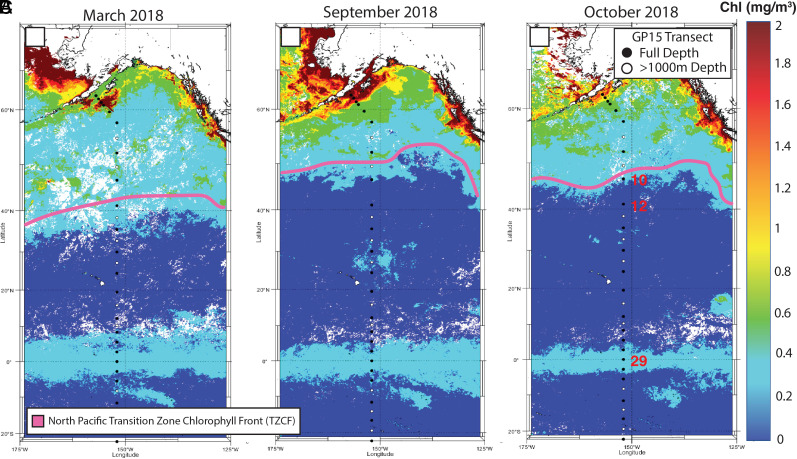
Fig. 1.
Surface chlorophyll data from the National Aeronautics and Space Administration (NASA) Aqua MODerate resolution Imaging Spectroradiometer (MODIS) satellite for (A) a spring end member such as March 2018, (B) a fall end member such as September 2018, and (C) the month of the GP15 cruise, October 2018. The pink line highlights the transition zone chlorophyll front (TZCF) at 0.2 mg/m3 in the North Pacific. U.S. GEOTRACES GP15 station markers are shown on each of the three panels, with the Panel C showing the labels in red for the prioritized stations of this paper: GP15 Stations 10 and 12 (TZCF) and 29 (Equator). Black dots represent stations where samples were collected from the entire water column, while white dots represent stations where samples were collected from the upper 1,000 m only.

