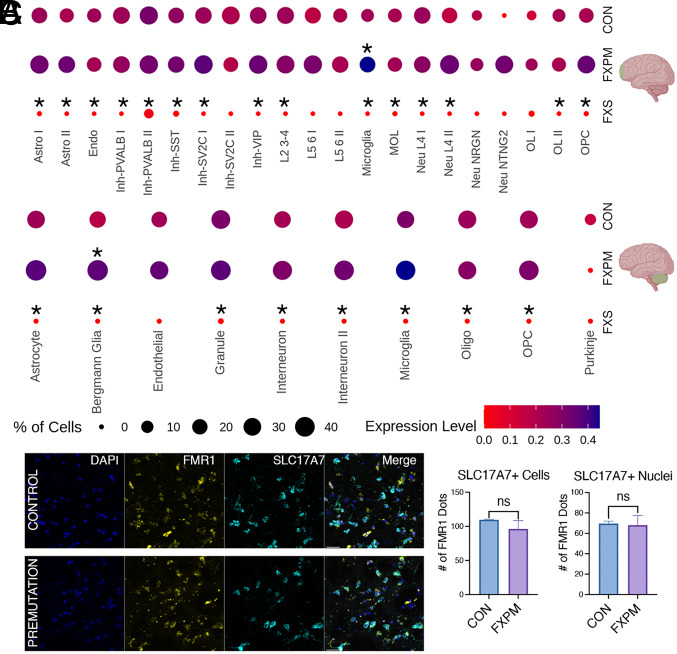
Fig. 2.
Modest FMR1 changes in premutation postmortem brain. (A) snRNA-seq of frontal cortex and cerebellar changes in FMR1 expression in premutation cases and FXS cases vs control. Cluster abbreviations as in Fig. 1. In premutation cases, only cerebellar Bergmann glia and cortical microglia demonstrated significant increases in FMR1 mRNA expression. There was widespread FMR1 reduction in FXS cases despite the smaller sample size. (Asterisk above the dot indicates padj < 0.05 for condition vs control comparison.) Expression level indicates average of scaled log-normalized expression. (B) Representative image from fluorescent in-situ hybridization demonstrating comparable FMR1 expression in excitatory neurons (SLC17A7 marker) in premutation vs control in the frontal cortex. (Scale bar, 30 μm). (C) No significant difference in FMR1 mRNA was seen in SLC17A7+ nuclei, or, using an extended boundary, SLC17A7+ cells (two-tailed t test, P = 0.91 (nuclei), P = 0.46 (cells)). n = 2 control, n = 3 premutation.

