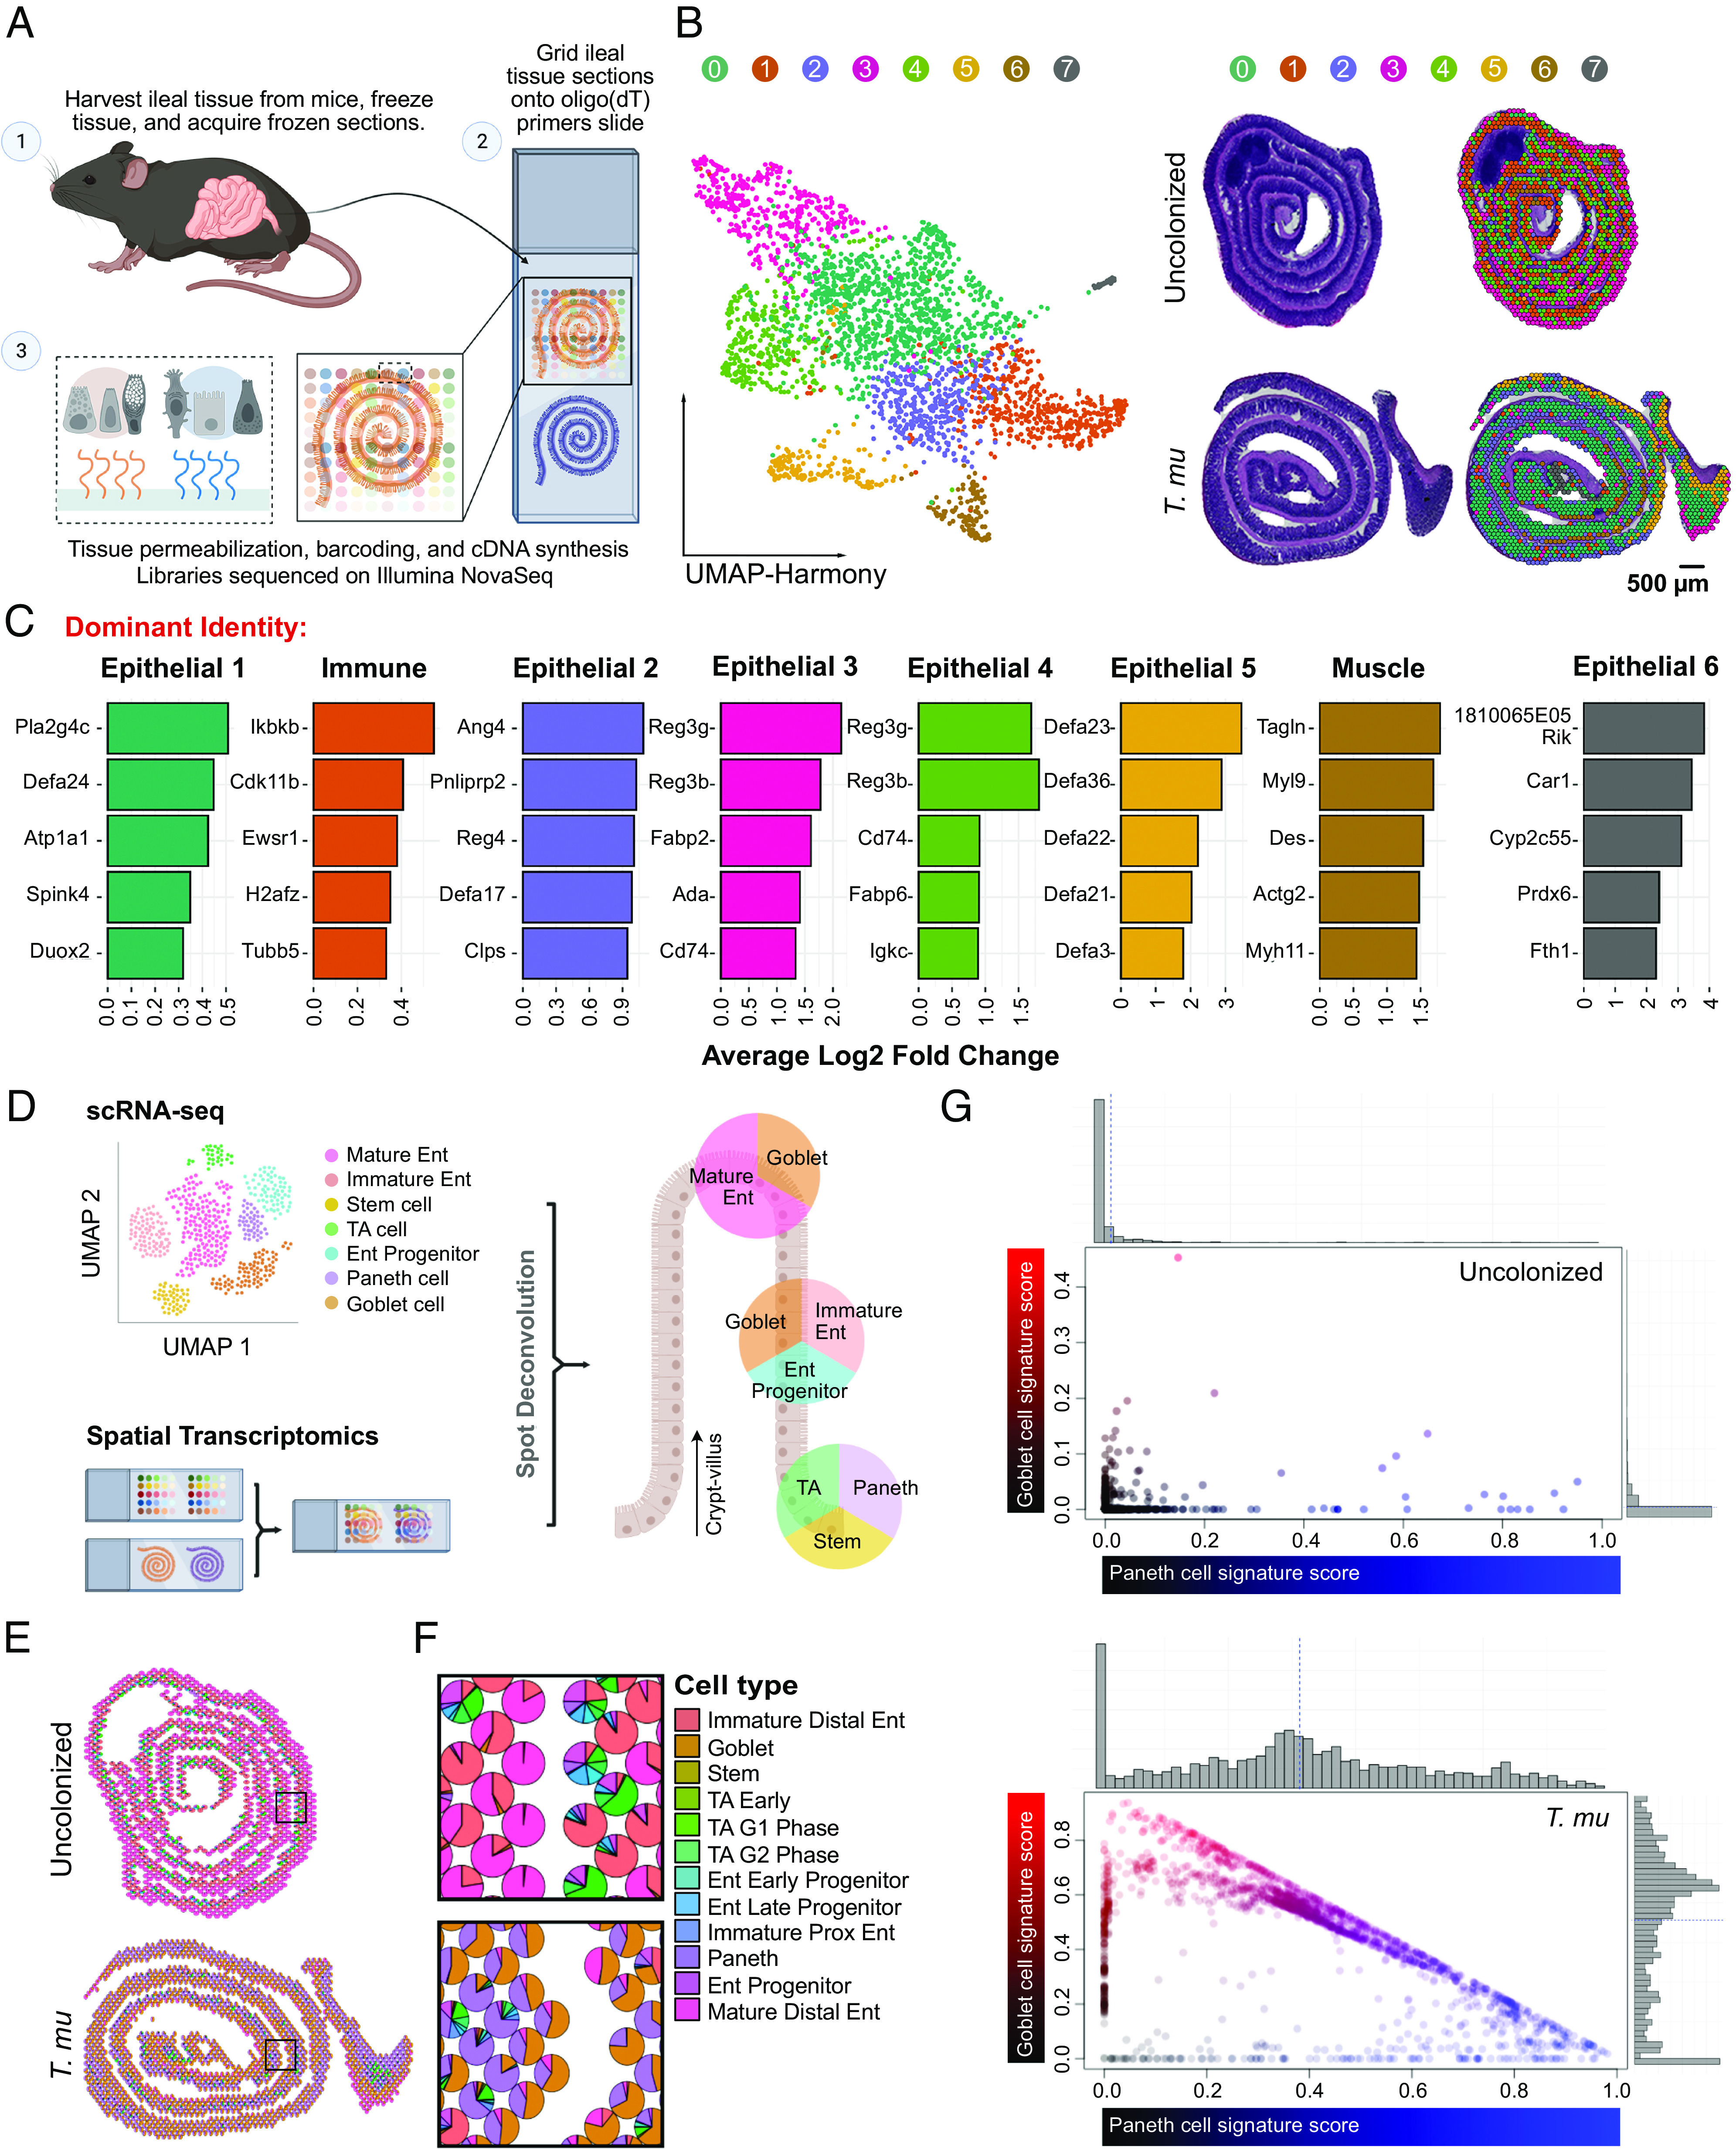
Fig. 1.

ST analysis of the T. mu–colonized SI reveals goblet and Paneth cell expansion. (A) Schematic of the ST pipeline. (B) Harmonized UMAP plots of ST spots organized by cluster identity (Left); corresponding hematoxylin and eosin (H&E)-stained tissue scans with overlaid Seurat clustering (Right). (C) Top 5 highly expressed genes for each cluster shown by log 2-fold change compared to other clusters. Clusters annotated based on dominance of gene expression associated with epithelial, immune, or muscle cells. (D) Schematic of the Seurat anchoring method to integrate a single-cell RNA sequencing (scRNA-seq) small intestinal epithelial dataset (30) with the ST dataset. (E and F) Scatter pie plots of the ileum depicting predicted epithelial cellular identities (E), with the corresponding zoomed regions of interest (F). Ent, enterocyte; TA, transit-amplifying; G1, G1/S cell-cycle phase; G2, G2/M cell-cycle phase; Prox, proximal. (G) Visualization of goblet (red) and Paneth cell (blue) signature scores of ST spots colored by identity. Gray histograms on top and right show the distribution of spots along each axis.
