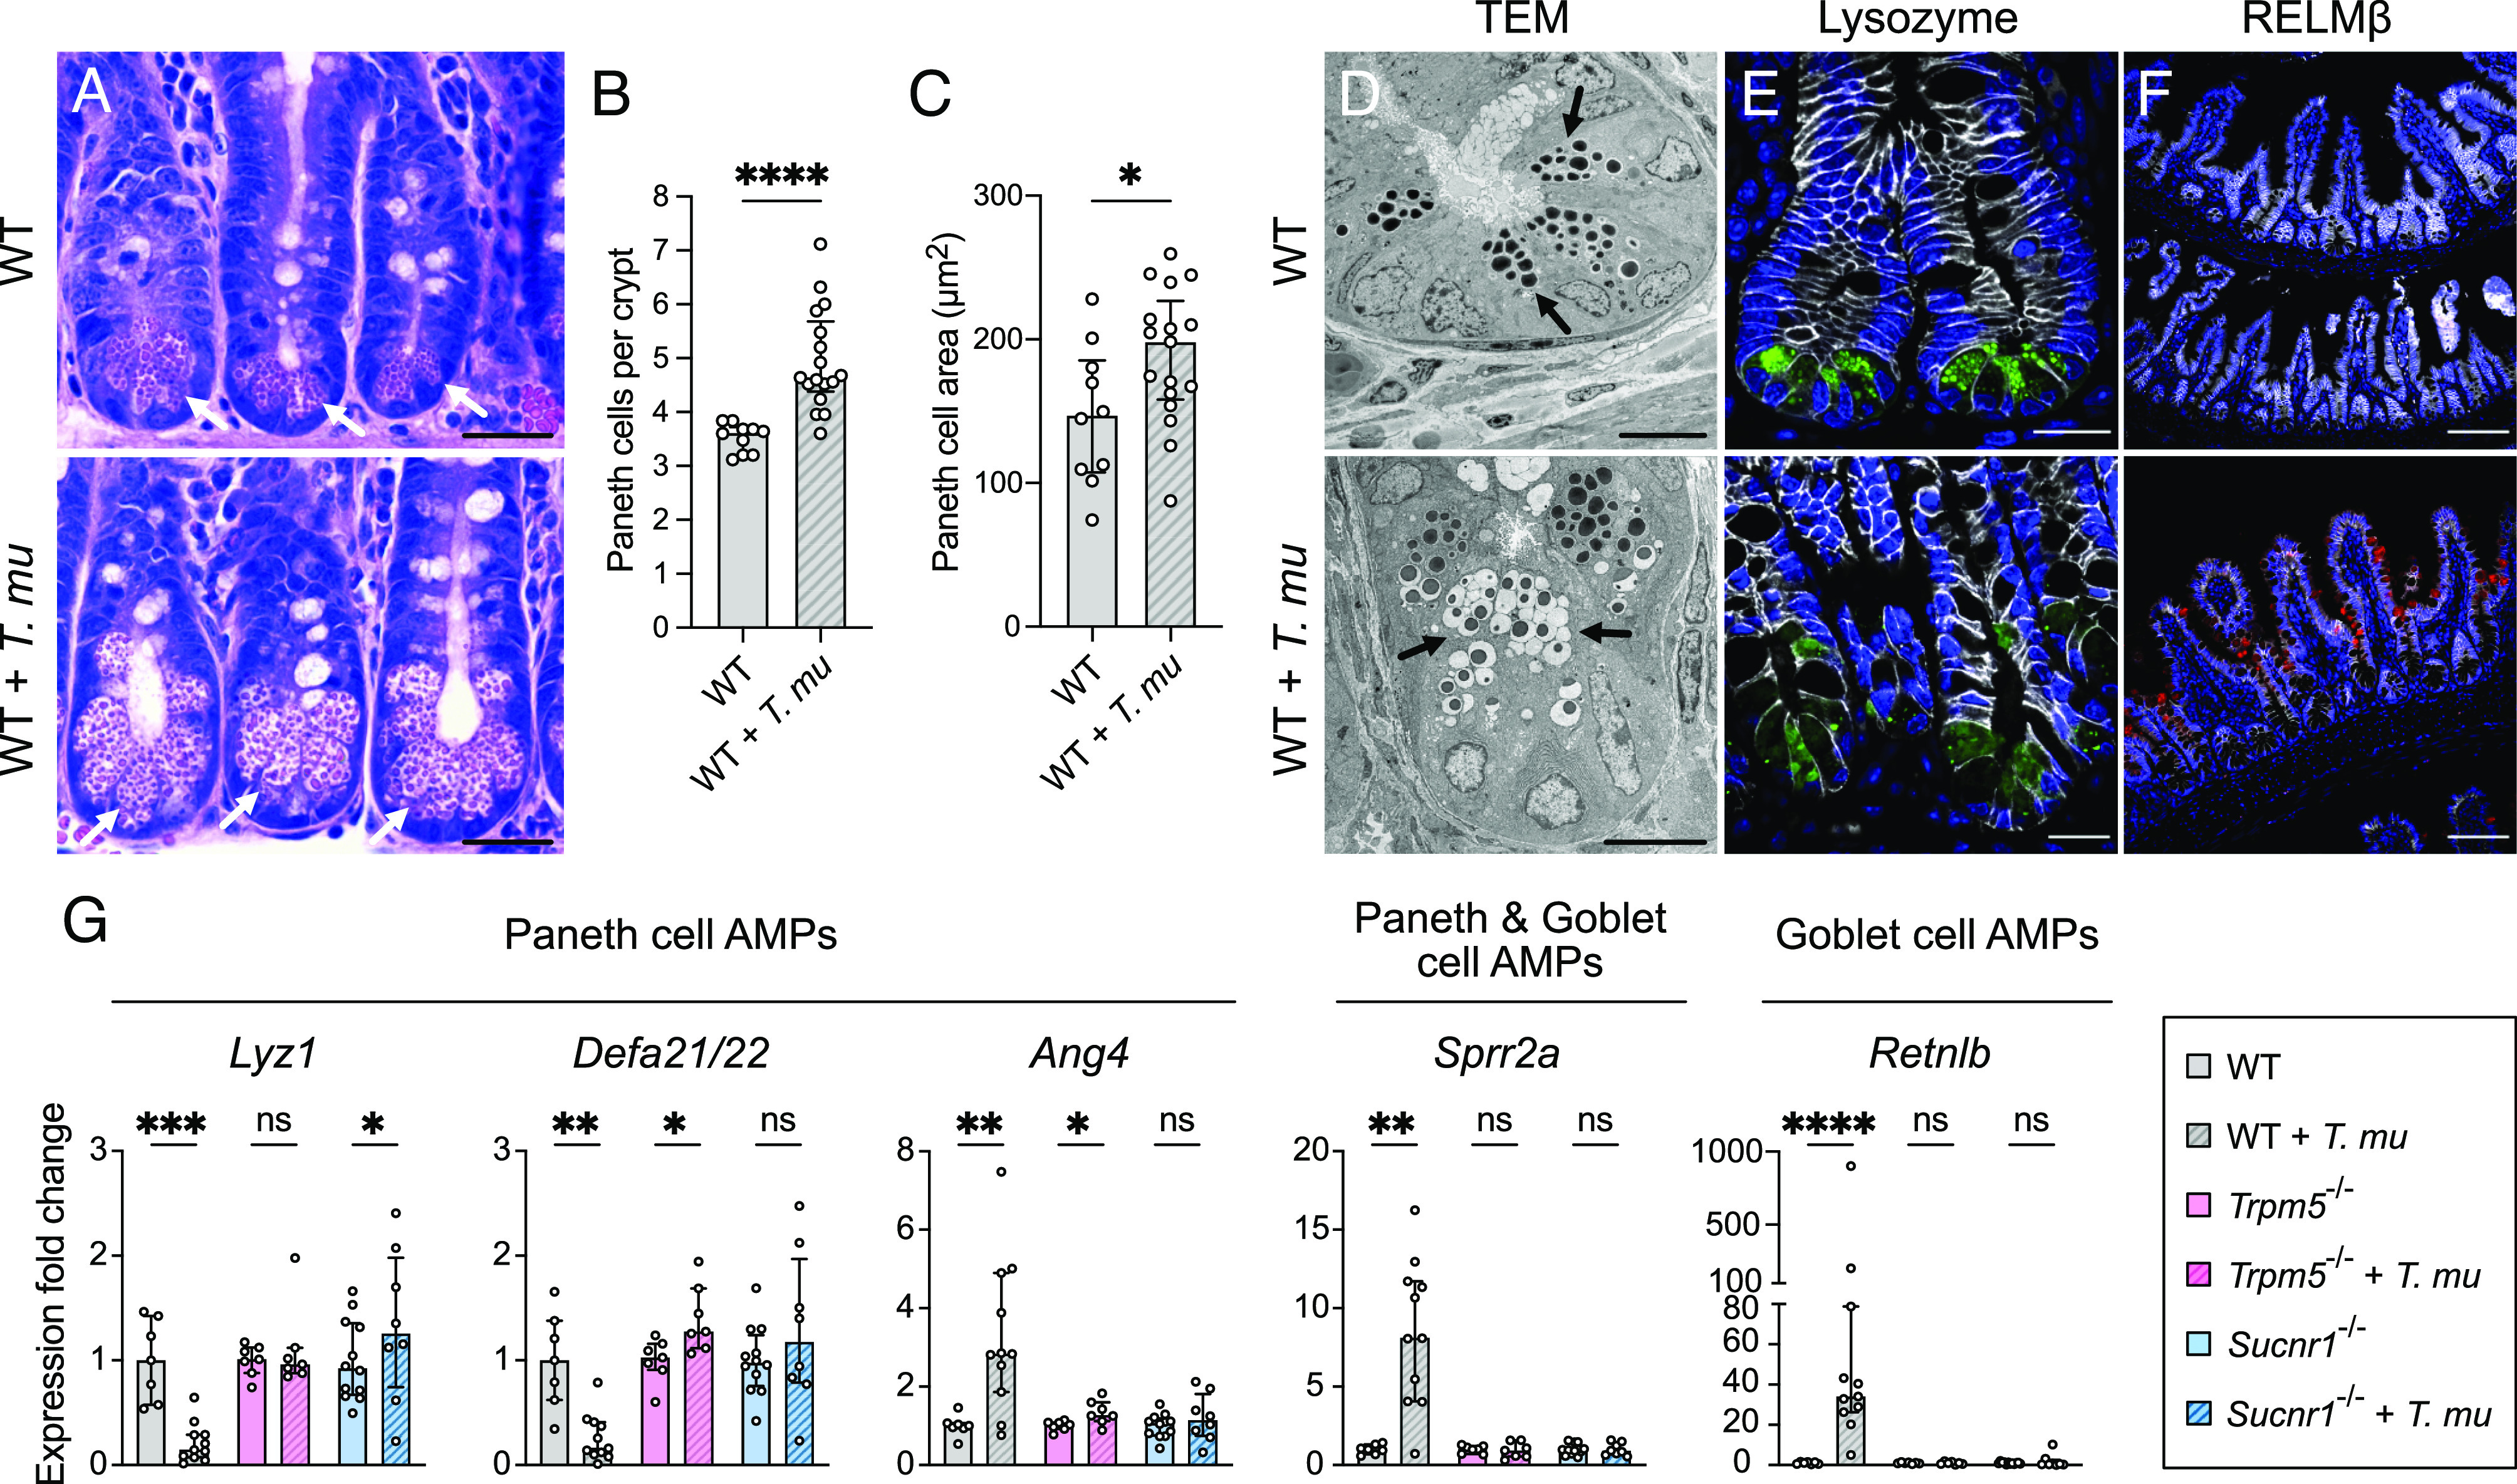
Fig. 3.

T. mu induces goblet and Paneth cell hyperplasia and alters AMP production in the distal SI via tuft cell stimulation. (A) Representative images of H&E-stained sections of the ileal crypts from uncolonized or T. mu–colonized WT mice. White arrows indicate representative Paneth cells. (Scale bar: 25 µm.) (B) Average number of Paneth cells per crypt in the ilea of uncolonized and T. mu–colonized WT mice (n = 10 to 17 mice per group). (C) Average size of individual Paneth cells (µm2) in the ilea of uncolonized and T. mu–colonized WT mice (n = 10 to 17 mice per group). (D) Representative transmission electron microscopy images of the ileal crypts from uncolonized or T. mu–colonized WT mice. Black arrows indicate representative Paneth cell secretory granules. (Scale bar: 10 µm.) (E and F) Representative fluorescence microscopy images of the ilea from uncolonized or T. mu–colonized WT mice. Nuclei (blue), E-cadherin (white), LYZ (Paneth cell AMP) (green), RELMβ (goblet cell AMP) (red). (E) Scale bar: 20 µm. (F) Scale bar: 100 µm. (G) Expression of representative AMP genes determined by qRT-PCR in the ileal epithelial fraction from uncolonized or T. mu–colonized WT, Trpm5−/−, and Sucnr1−/− mice (n = 7 to 12 mice per group). Relative expression normalized to Gapdh. In panels B, C, and G, center values = median; error bars = interquartile range (IQR). Significance was determined using the Mann–Whitney U test. ns = no significance, *P < 0.05, **P < 0.01, ***P < 0.001, ****P < 0.0001.
