
Fig. 6.
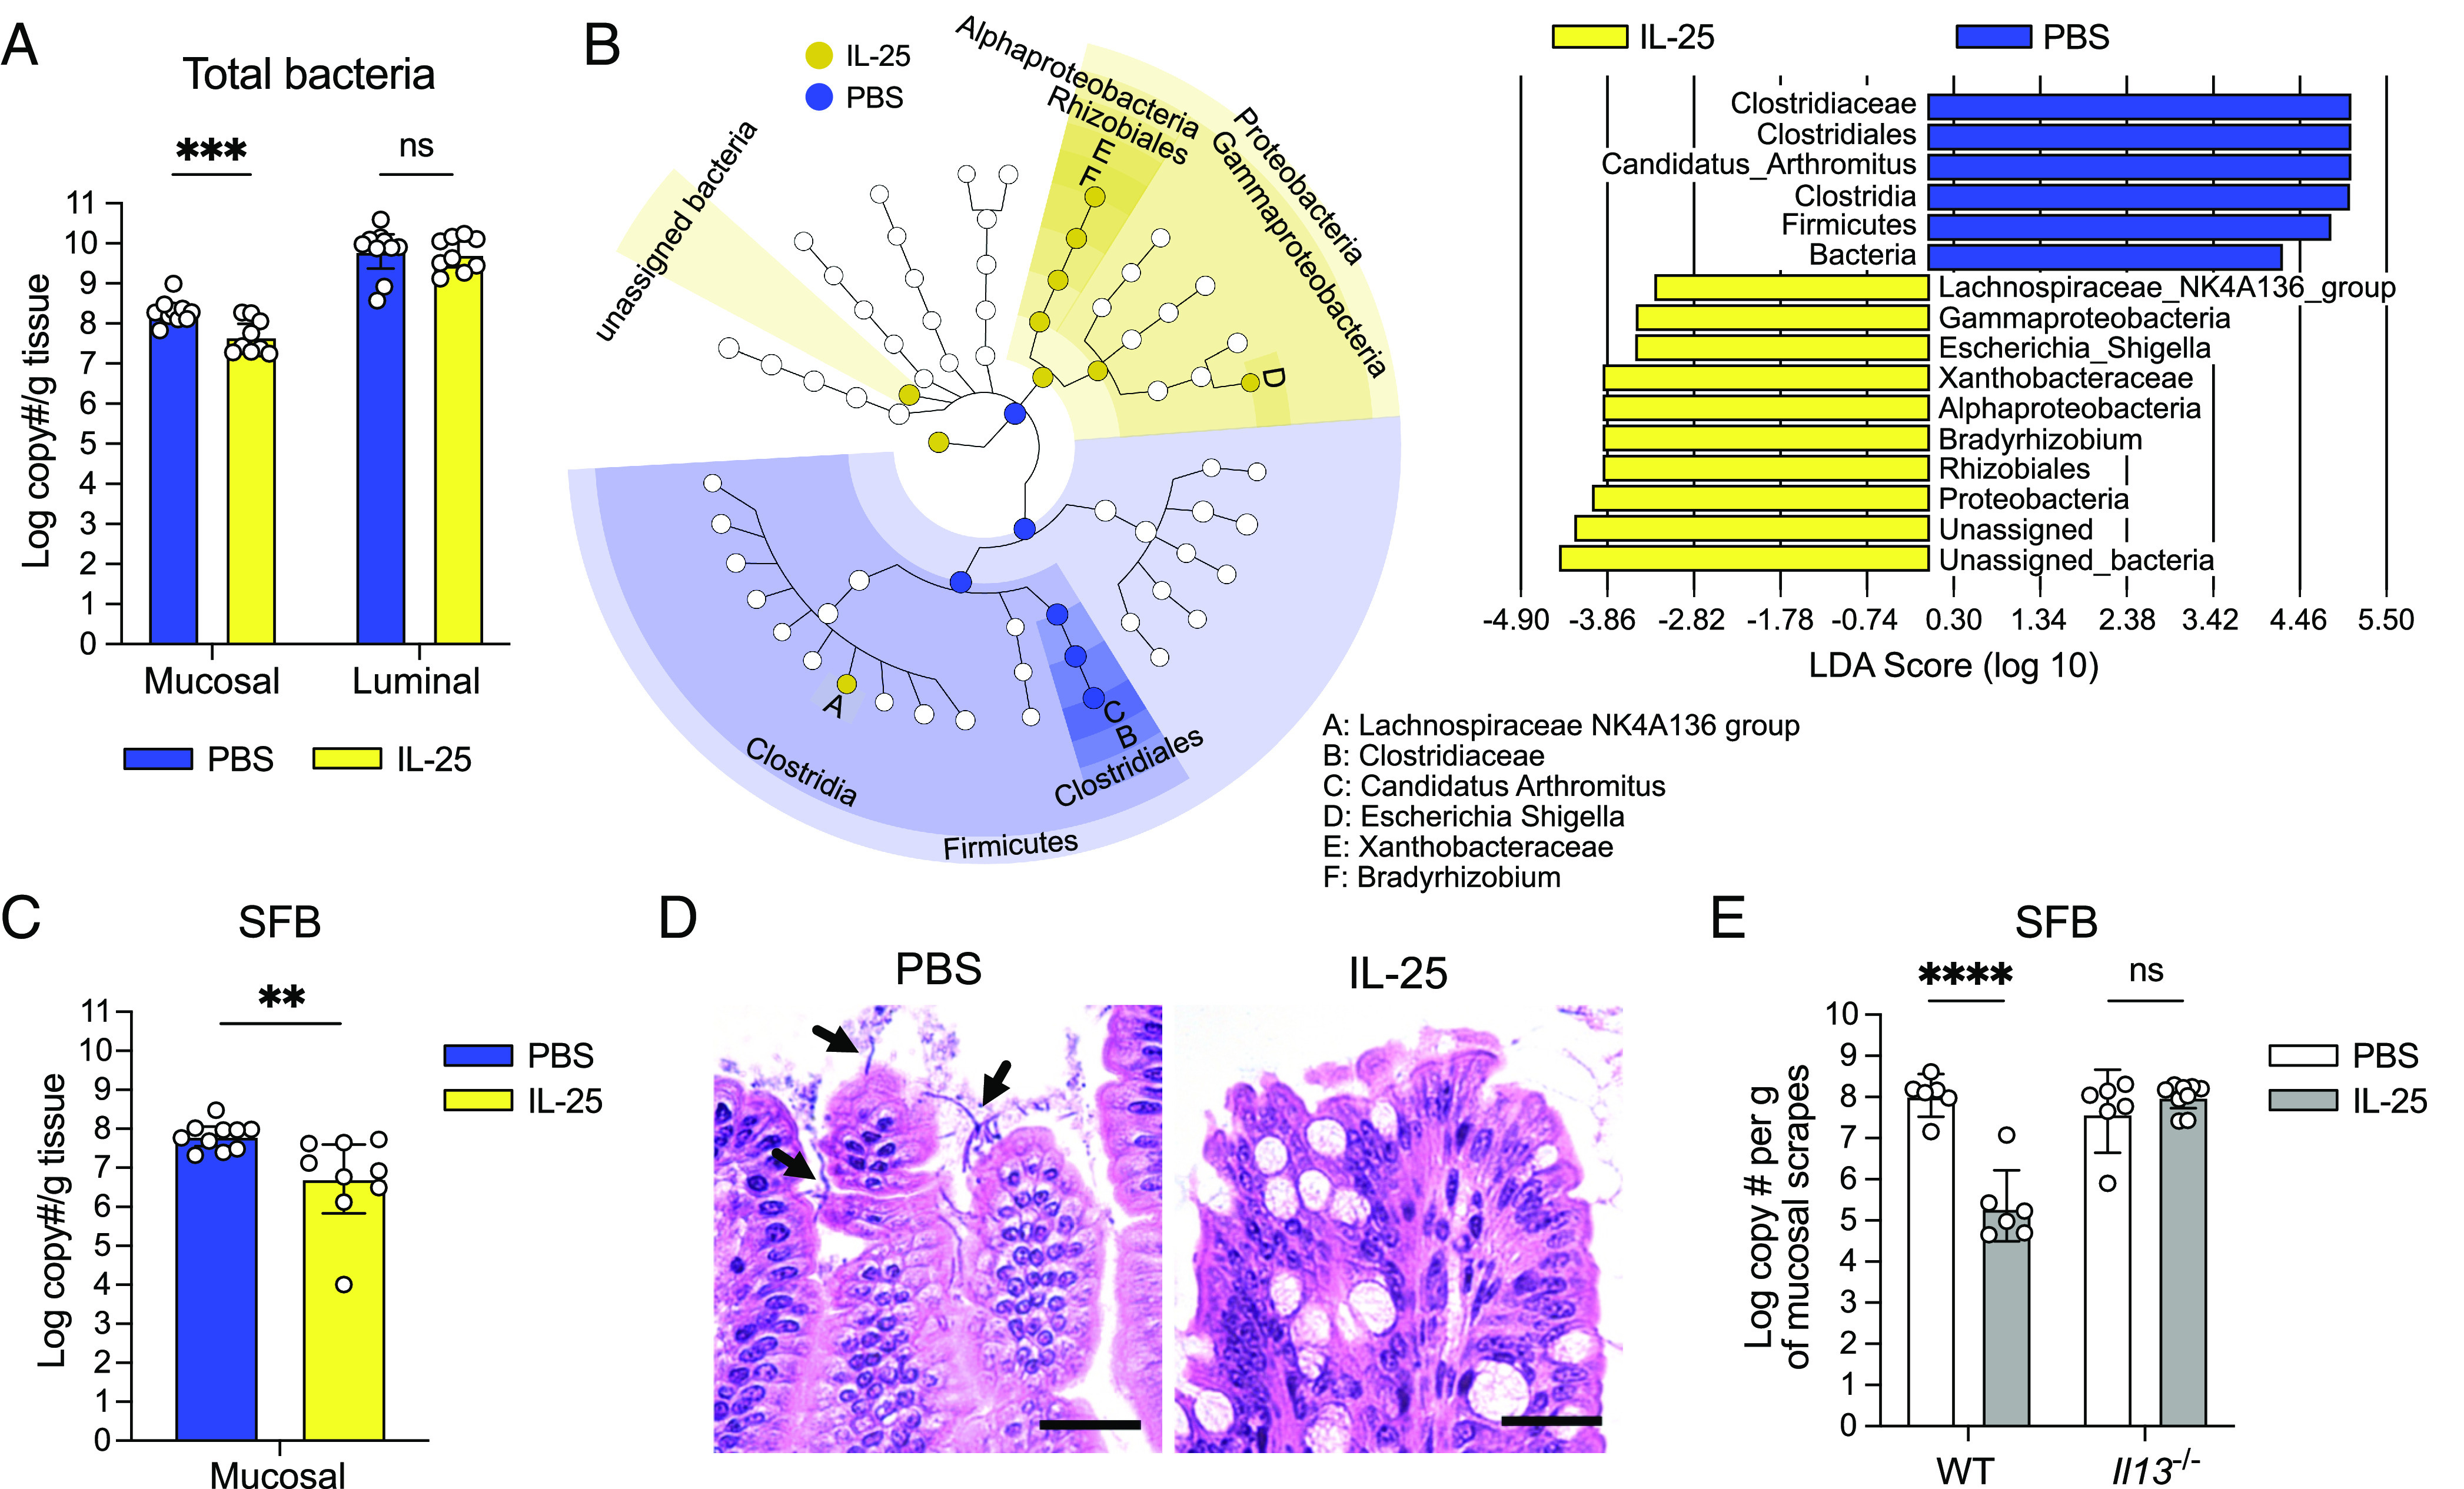
Type 2 immune induction depletes mucosa-associated bacteria in the SI. (A) Absolute quantification of total bacterial 16S rRNA gene copies in the ileal mucosal and luminal fractions of PBS- or IL-25-injected mice (n = 9 to 10 mice per group). (B) Linear discriminant analysis (LDA) Effect Size (LEfSe) analysis using a LDA threshold score of 2 to identify ileal mucosa-associated bacterial taxa in PBS- or IL-25-injected mice. The cladogram (Left) highlights taxonomic relatedness of bacteria, while the LDA plot (Right) is an ordered list of enriched bacteria. (C) Absolute quantification of SFB 16S rRNA gene copies in the ileal mucosal fractions of PBS- or IL-25-injected mice (n = 9 to 10 mice per group). (D) Representative images of Carnoy’s-fixed, H&E-stained sections of ileal villi from PBS- or IL-25-injected mice showing SFB (black arrows). (Scale bar: 25 µm.) (E) Absolute quantification of SFB 16S rRNA gene copies in the ileal mucosal fractions of PBS- or IL-25-injected WT and Il13−/− mice (n = 6 to 9 mice per group). In Panels A, C, and E, center values = geometric mean; error bars = 95% CI. Significance was determined using a generalized linear model. ns = no significance, **P < 0.01, ***P < 0.001, ****P < 0.0001.