
Fig. 3.
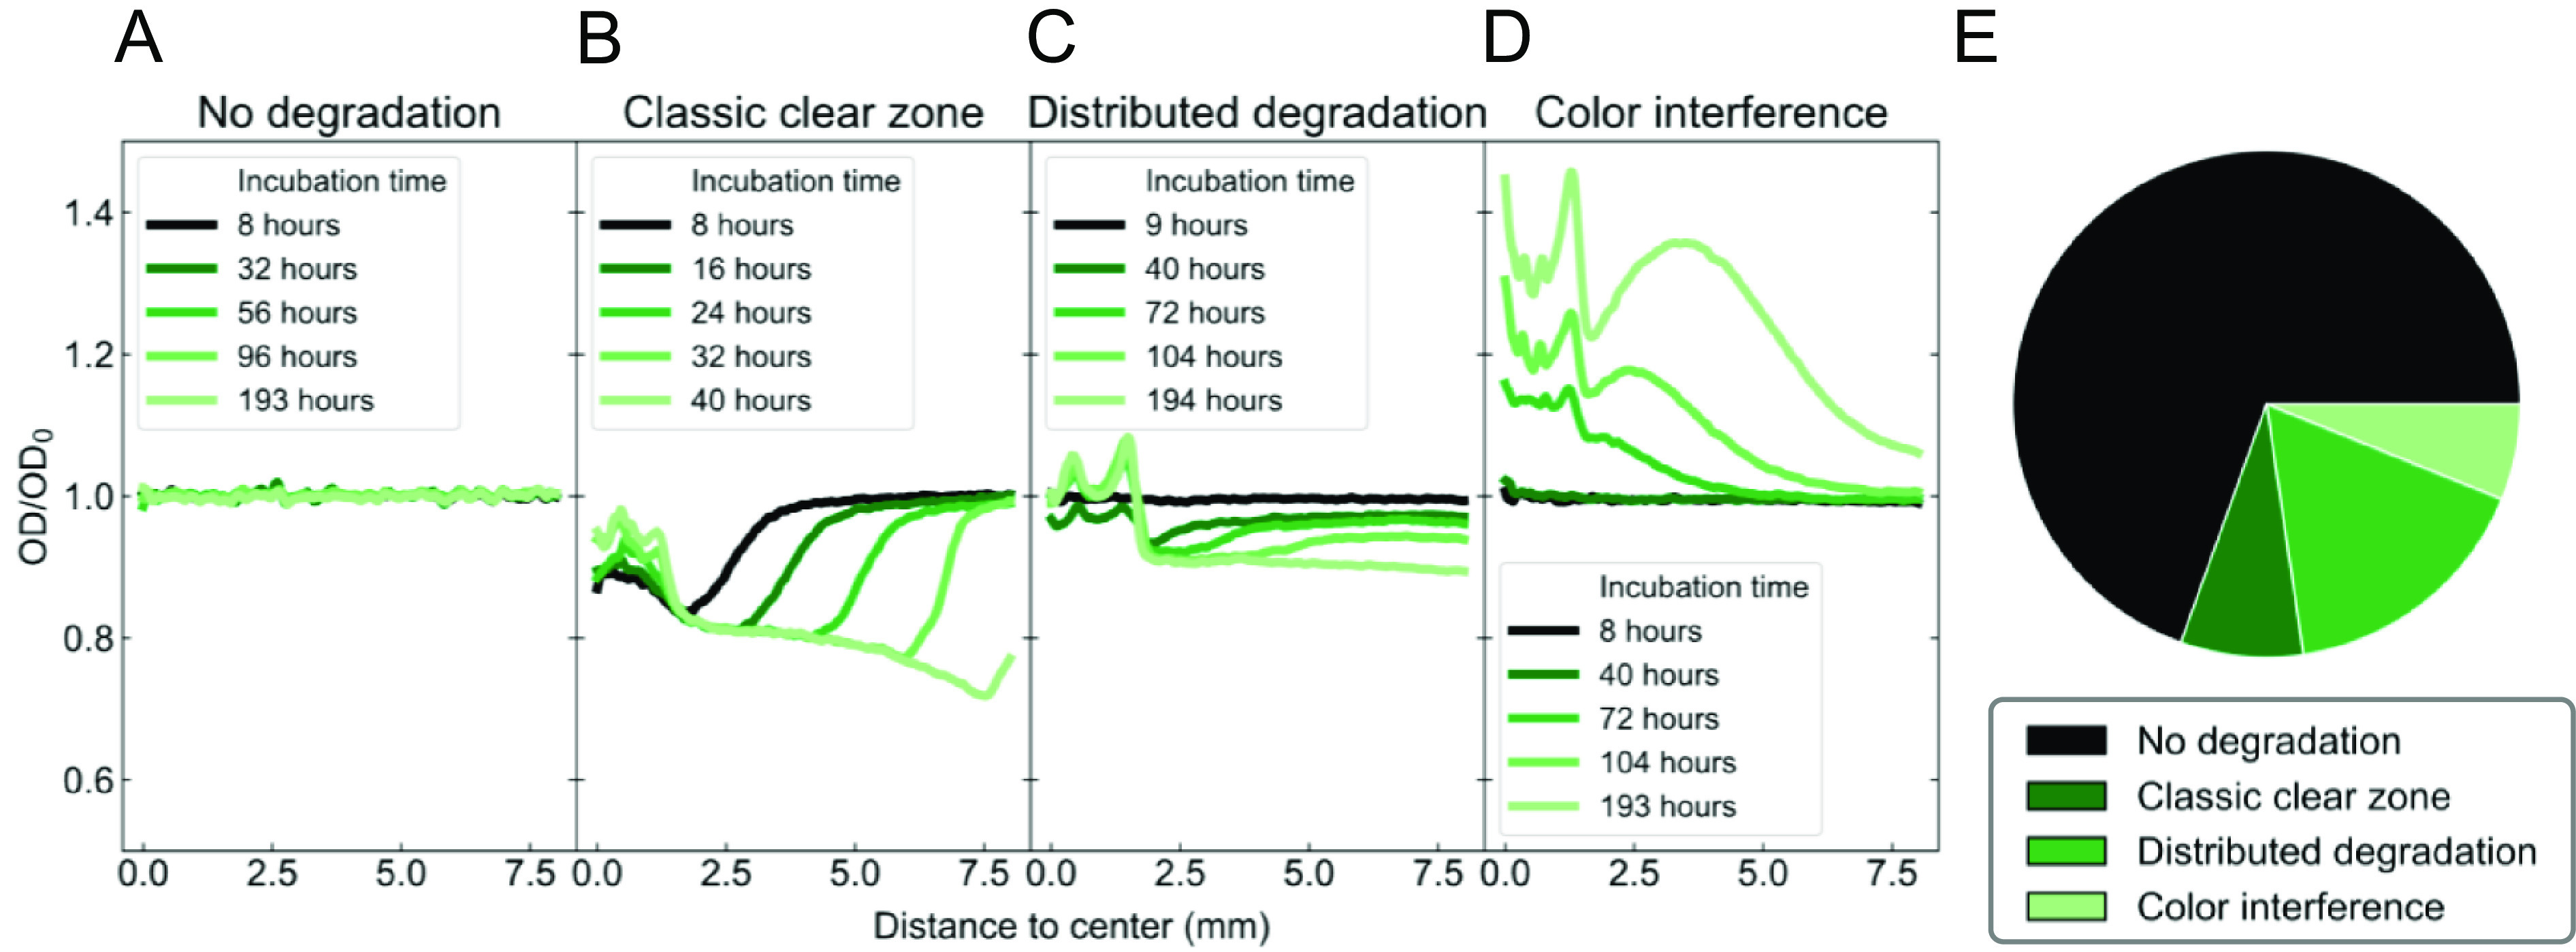
(A–D) Biodegradation behaviors observed from shading curves of clear-zone samples. The different behaviors depend on the enzymatic activity and the rate of biofragmentation. (E) Distribution of all behaviors in the dataset.
Official websites use .gov
A
.gov website belongs to an official
government organization in the United States.
Secure .gov websites use HTTPS
A lock (
) or https:// means you've safely
connected to the .gov website. Share sensitive
information only on official, secure websites.
(A–D) Biodegradation behaviors observed from shading curves of clear-zone samples. The different behaviors depend on the enzymatic activity and the rate of biofragmentation. (E) Distribution of all behaviors in the dataset.