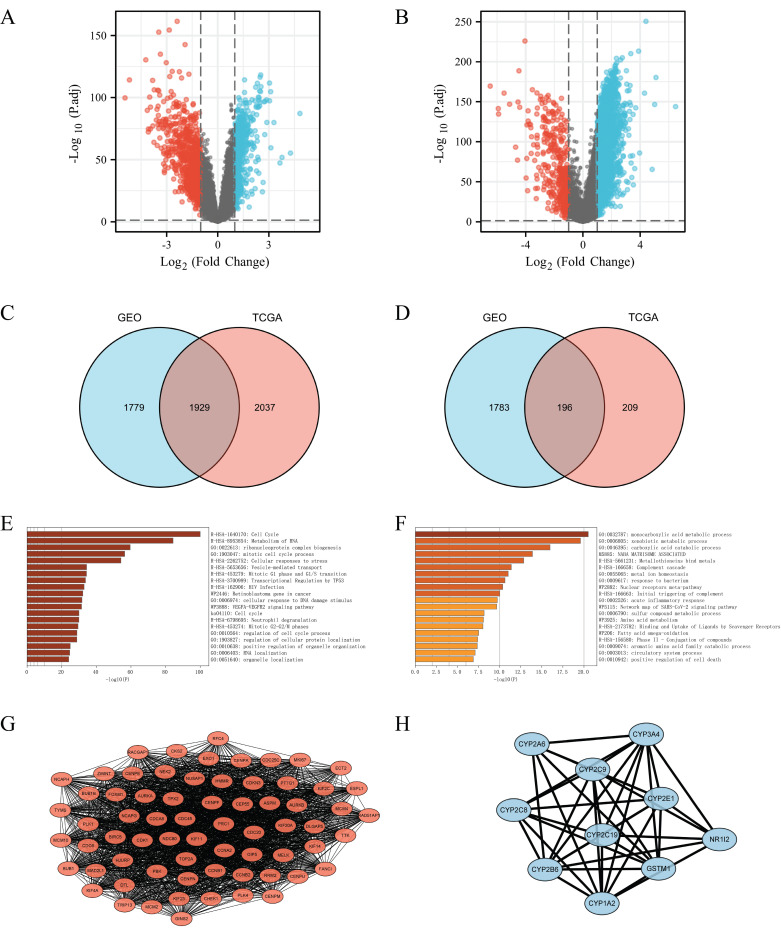
Figure 3.
DEGs were selected from the GEO and TCGA datasets with enrichment and PPI network analysis. (A) Volcano plot of differentially expressed genes associated with FANCI in LIHC patients, which were analyzed by using GEO data (GSE14520). Upregulated genes are shown in red and downregulated genes are shown in green. (B) Volcano plot of differentially expressed genes associated with FANCI in LIHC patients, which were analyzed by using TCGA data. Upregulated genes are shown in pink and downregulated genes are shown in blue. (C, D) Overlapping upregulated and downregulated DEGs correlated with FANCI between the TCGA and GEO gene lists. (E, F) Enrichment of function and signaling pathways of positively and negatively correlated DEGs in LIHC. (G) PPI network of the 68 positive Hub genes (MCODE score = 62.388). (H) PPI network of the 10 negative Hub genes (MCODE score = 8.889).

