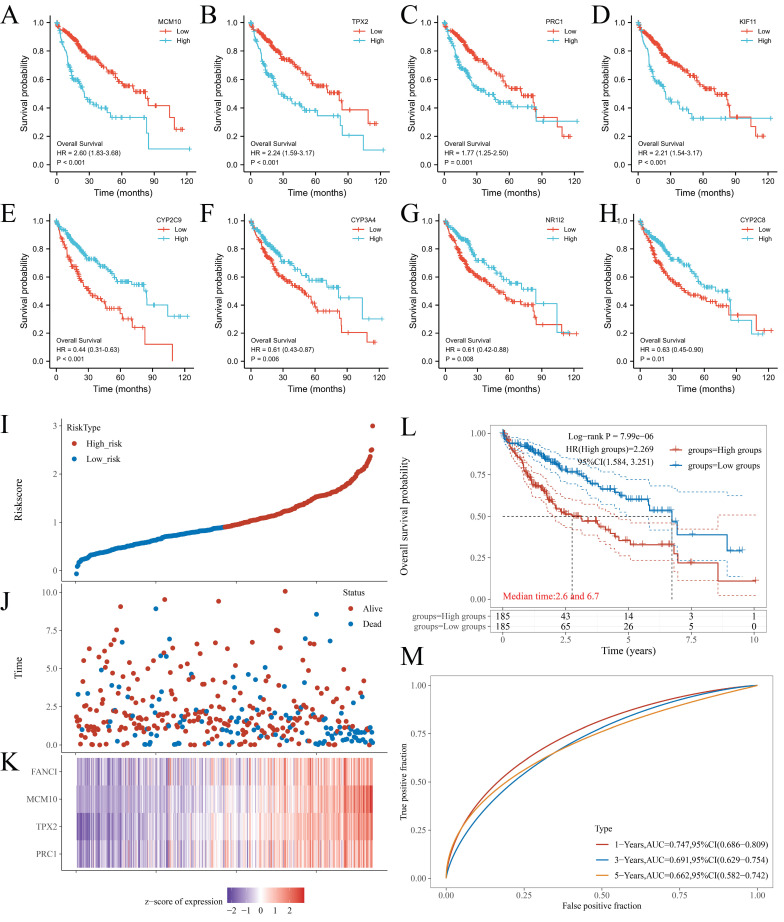
Figure 4.
KM plots of OS of key genes in LIHC patients. (A) MCM10; (B) TPX2; (C) PRC1; (D) KIF11; (E) CYP2C9; (F) CYP3A4; (G) NR1I2; and (H) CYP2C8. (I) Dotted curve of risk score. (J) Scatter diagram of survival status. (K) Heatmap of the gene expression pattern. (L) Overall survival analysis of the prognostic model. (M) Time-dependent ROC analysis, 1-, 3-, 5-years.

