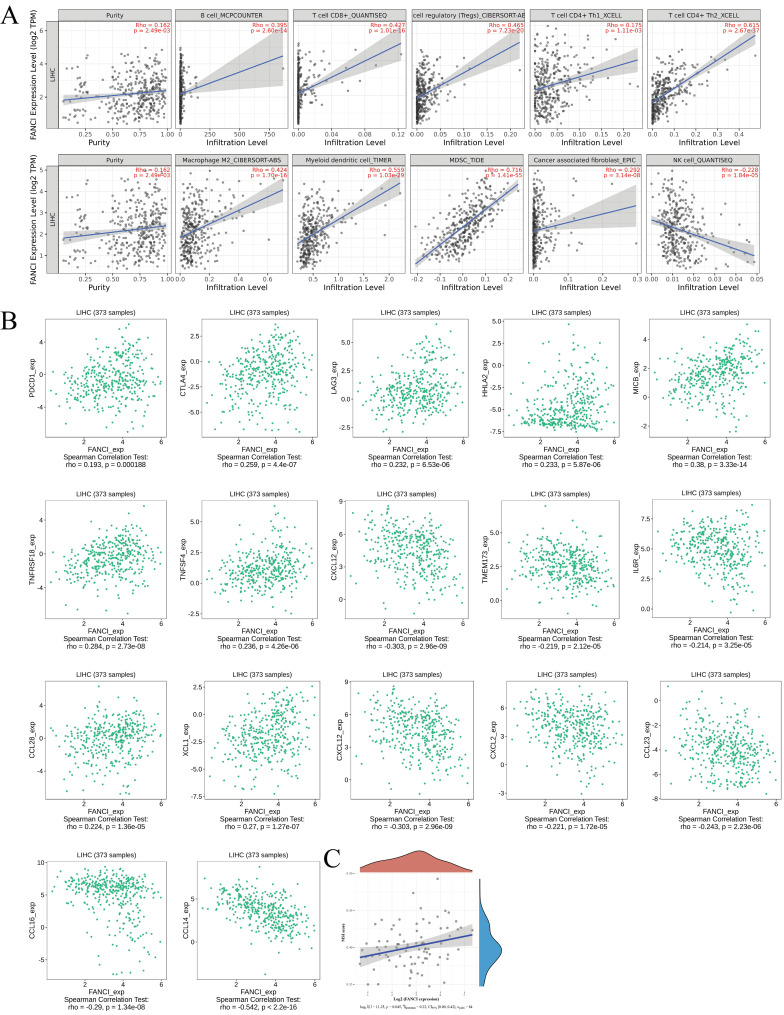
Figure 5.
Immune infiltration state associated with the FANCI in LIHC. (A) Scatter plots of the level of tumor-infiltrating immune cells correlated to the expression of FANCI in LIHC. (B) Scatter plots of the expression of immune molecular correlated to the expression of FANCI in LIHC. (C) Scatter plots of the relationship between the expression of FANCI and MSI level in patients with LIHC.

